You're viewing free preview questions — 4 questions previewing here — subscribe to unlock 311 more, plus the Full Question Bank, Mock Papers & Worksheets.Upgrade
Collecting and Organizing Data — Free MYP5 Mathematics (Extended) Practice Questions

1QuestionData collection and generation (including surveys)Assessment Practice
5 marks~8 minCriterion A
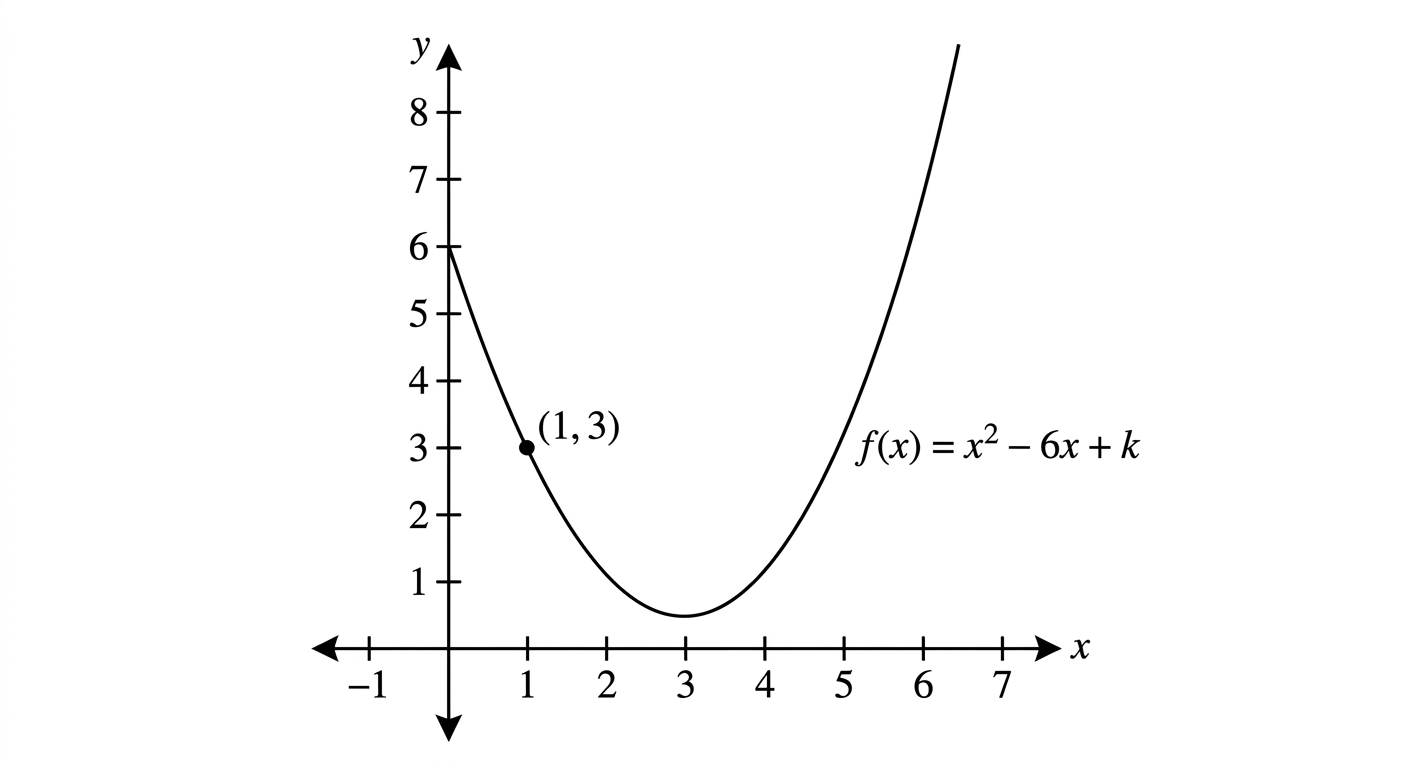
The diagram shows the graph of for , where is a constant. The graph passes through the point .
a
Show that . [1]
b
Find the coordinates of the vertex of the graph. [2]
c
State the values of for which has exactly one solution in the domain . [2]

Solutions
2QuestionData collection and generation (including surveys)Assessment Practice
5 marks~8 minCriterion B
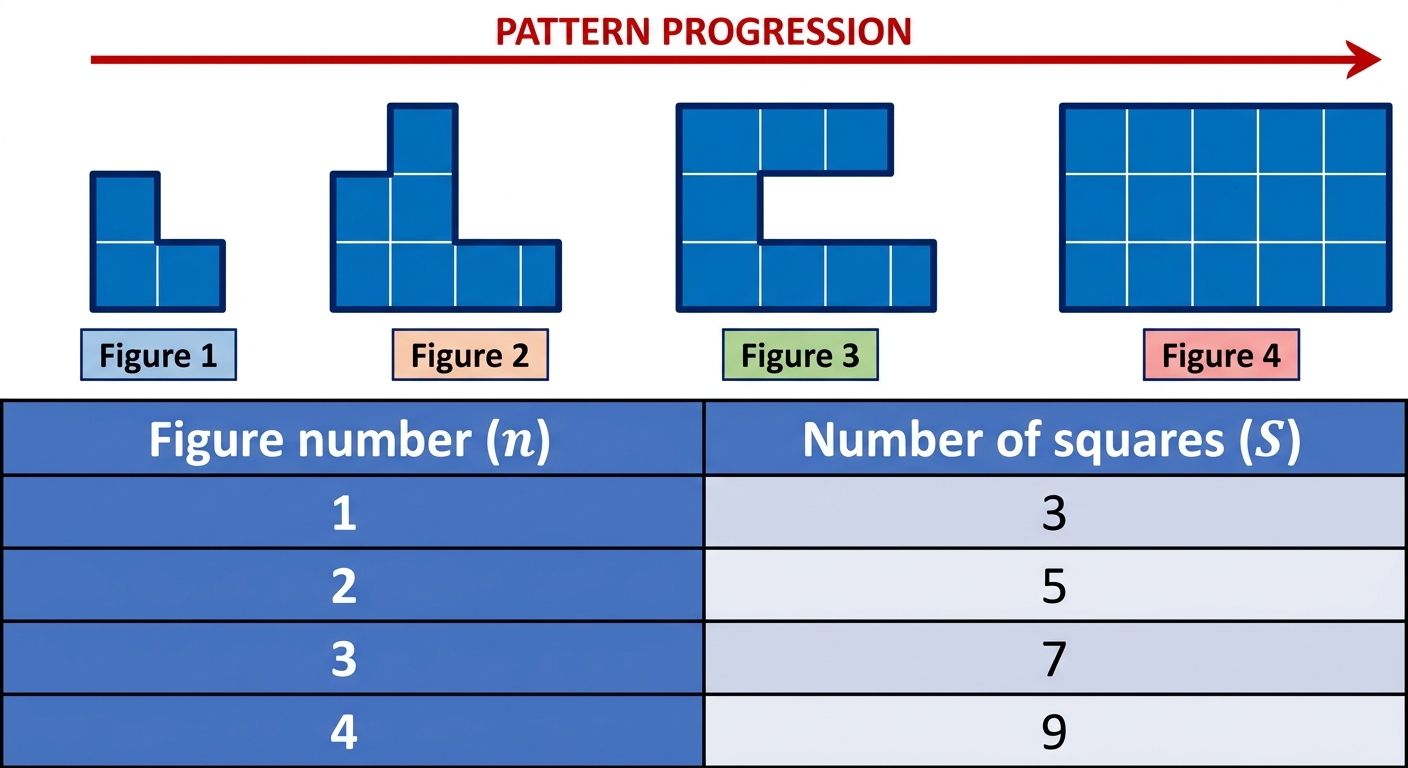
The diagram shows the first four figures of a pattern made from small squares arranged in an L-shape.
The table below gives the number of small squares in each figure.
The table below gives the number of small squares in each figure.
| Figure number () | 1 | 2 | 3 | 4 |
|---|---|---|---|---|
| Number of squares () | 3 | 5 | 7 | 9 |
a
Write down the number of small squares in Figure 5. [1]
b
Find a rule for the number of small squares in Figure , giving your answer in the form
where and are integers to be determined. [2]
where and are integers to be determined. [2]
c
A student claims that no figure in this pattern can contain exactly 50 small squares. Justify whether the student is correct. [2]
Solutions
3QuestionOrganizing Data for Effective AnalysisAssessment Practice
6 marks~9 minCriterion C
Data
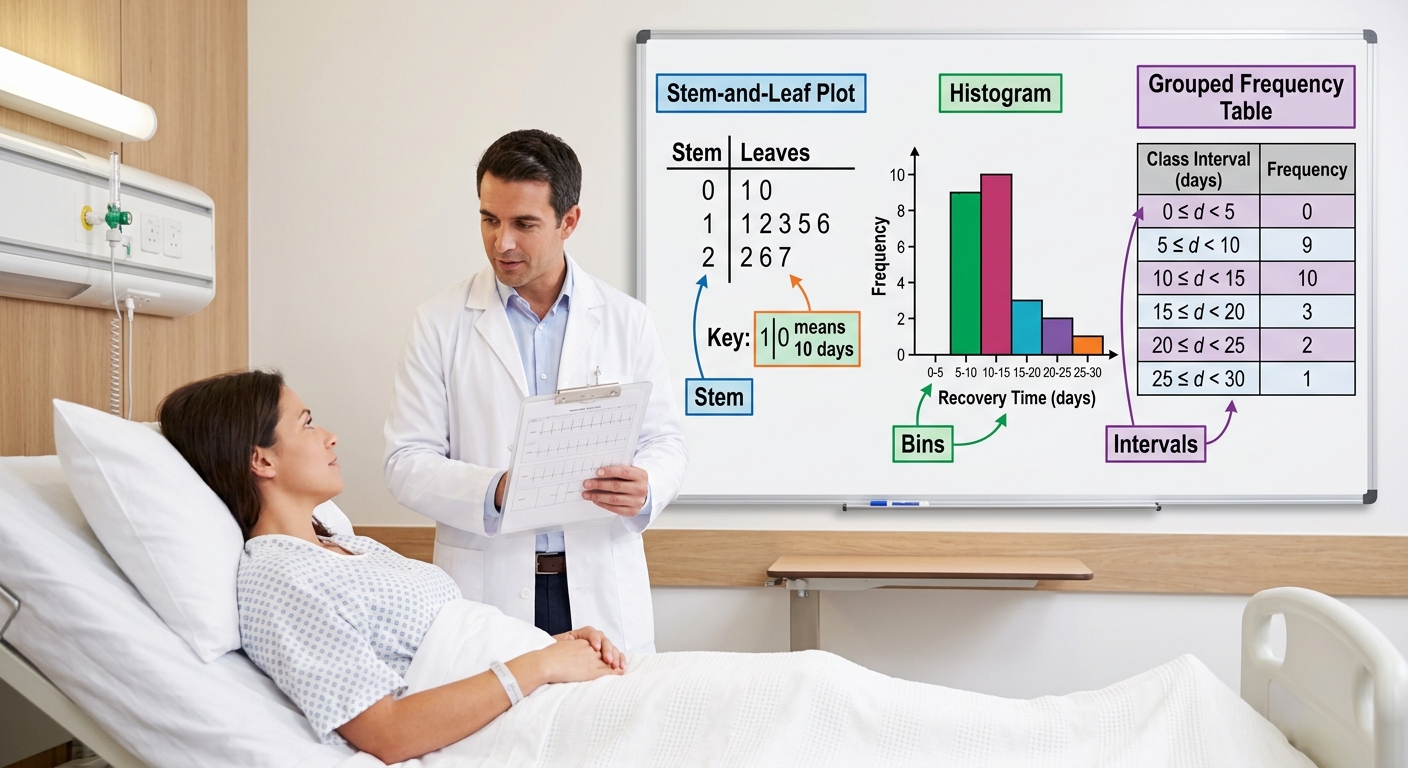
a stem-and-leaf plot, a histogram, and a grouped frequency table.A hospital is analysing post-surgery recovery times (in days) for a sample of 24 patients:
5, 6, 7, 7, 8, 8, 8, 9, 9, 10, 10, 10, 11, 11, 12, 13, 14, 15, 16, 18, 20, 22, 25, 30
The hospital is considering three methods to organise this
5, 6, 7, 7, 8, 8, 8, 9, 9, 10, 10, 10, 11, 11, 12, 13, 14, 15, 16, 18, 20, 22, 25, 30
The hospital is considering three methods to organise this
a
Construct a stem-and-leaf plot for the recovery times. Include a key. [2]
b
A grouped frequency table uses the intervals 5–9, 10–14, 15–19, 20–24, 25–30. Explain one way in which this grouping could lead to a misinterpretation of the data compared with your stem-and-leaf plot. [2]
c
The hospital administrator must decide whether to allocate additional nursing staff to patients whose recovery exceeds 14 days. Advise the administrator which representation — the stem-and-leaf plot or the grouped frequency table — to use when making this staffing decision, and justify your advice with a specific reference to the data. [2]
Solutions
4QuestionDesigning Surveys and QuestionnairesAssessment Practice
6 marks~9 minCriterion D
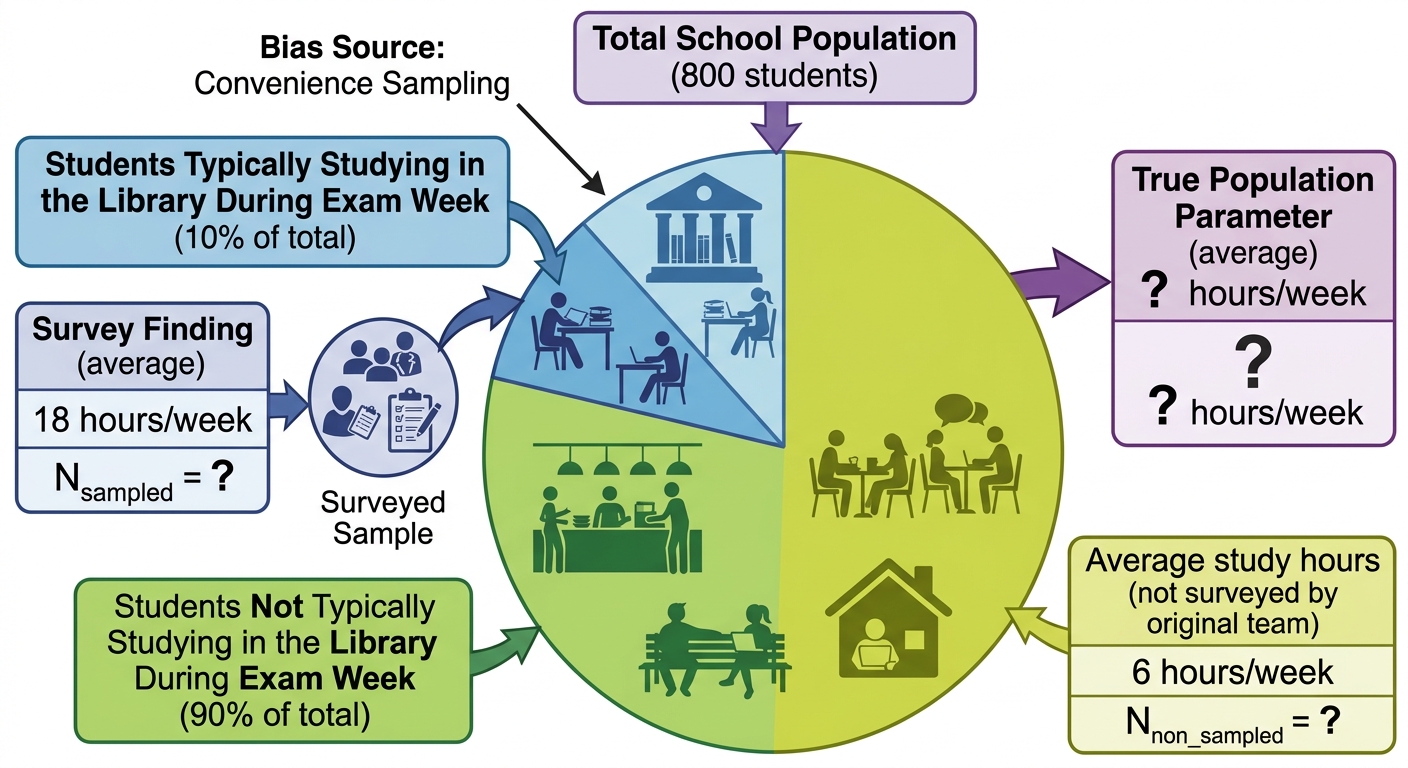
A school wants to estimate the average number of hours students spend studying each week. During exam week, the survey team asks every student present in the library. These 80 students report an average of 18 hours per week. The remaining 720 students, surveyed separately, report an average of 6 hours per week.
a
Identify the type of sampling bias present in this survey design and explain how it causes the library-only result to overestimate the true school-wide average. [2]
b
Calculate the true average weekly study hours for all 800 students. Show your working clearly. [2]
c
The school principal states: "An average of 7.2 hours per week is too low to reflect real student effort — we should use the library figure of 18 hours when reporting to parents."
Advise the principal on whether the figure of 18 hours should be used in the school-wide report, justifying your answer with reference to what the calculated average actually represents. [2]
Advise the principal on whether the figure of 18 hours should be used in the school-wide report, justifying your answer with reference to what the calculated average actually represents. [2]
Solutions
That's every free question here — 4 of 315.
+311 more questions, plus Mock Papers & Worksheets, are waiting in Premium.