You're viewing free preview questions — 4 questions previewing here — subscribe to unlock 85 more, plus the Full Question Bank, Mock Papers & Worksheets.Upgrade
Correlation — Free MYP5 Mathematics (Extended) Practice Questions

1QuestionCorrelation using technology (value and interpretation)Assessment Practice
6 marks~9 minCriterion D
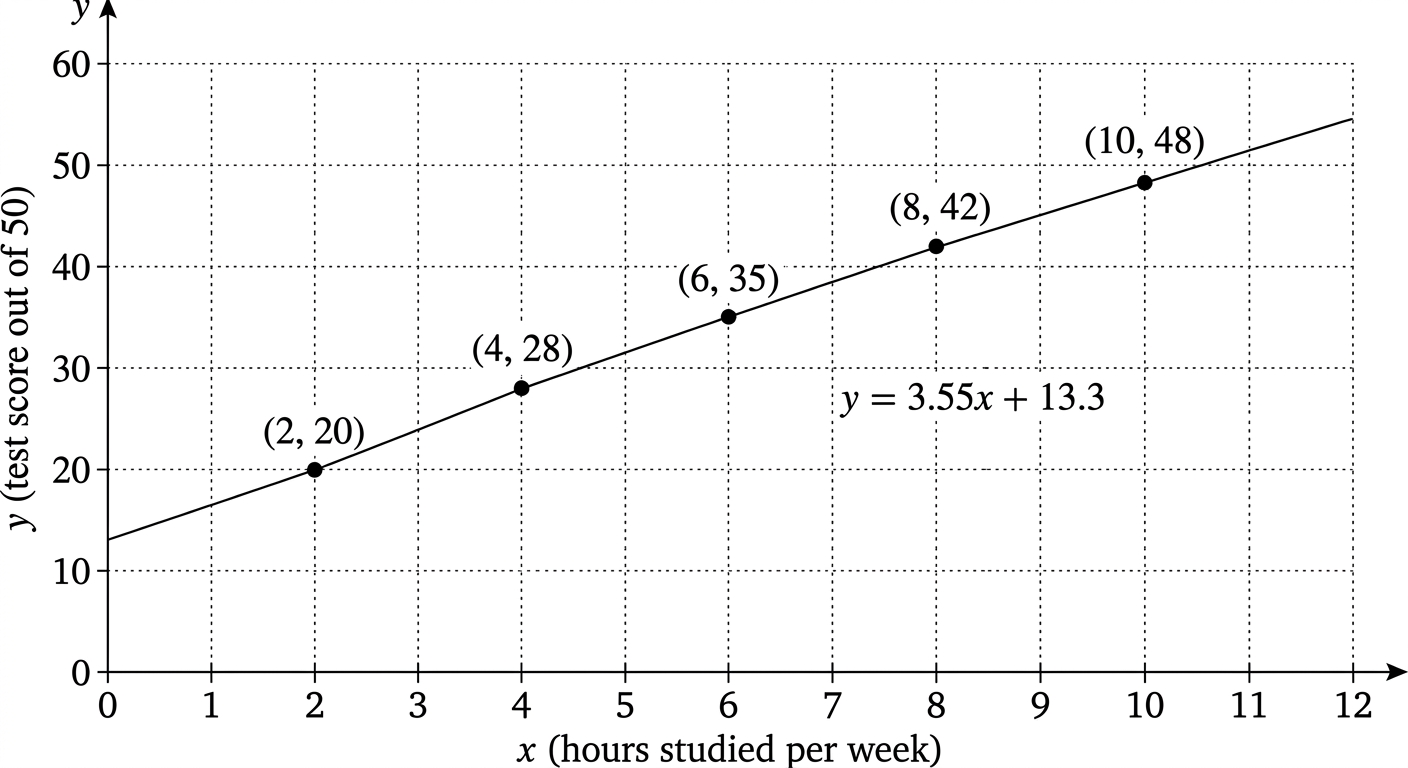
The table below shows the number of hours studied per week () and the test score out of 50 () for five students.
: 2, 4, 6, 8, 10
: 20, 28, 35, 42, 48
A student claims that a linear model fits this data well and uses the regression line to make predictions.
: 2, 4, 6, 8, 10
: 20, 28, 35, 42, 48
A student claims that a linear model fits this data well and uses the regression line to make predictions.
a
Using your calculator, find the Pearson correlation coefficient . Give your answer to 3 significant figures. [1]
b
The regression line of on has the form . Using your calculator, find the values of and to 3 significant figures. Hence find the predicted score for a student who studies for 7 hours per week. [3]
c
A sixth student studies for 15 hours per week and scores 49 out of 50. The teacher uses the regression line to predict this score. Advise the teacher whether the regression line should be used to predict scores for students who study 15 hours per week, justifying your answer with two distinct mathematical reasons. [2]

Solutions
2QuestionCorrelation using technology (value and interpretation)Assessment Practice
10 marks~15 minCriterion B
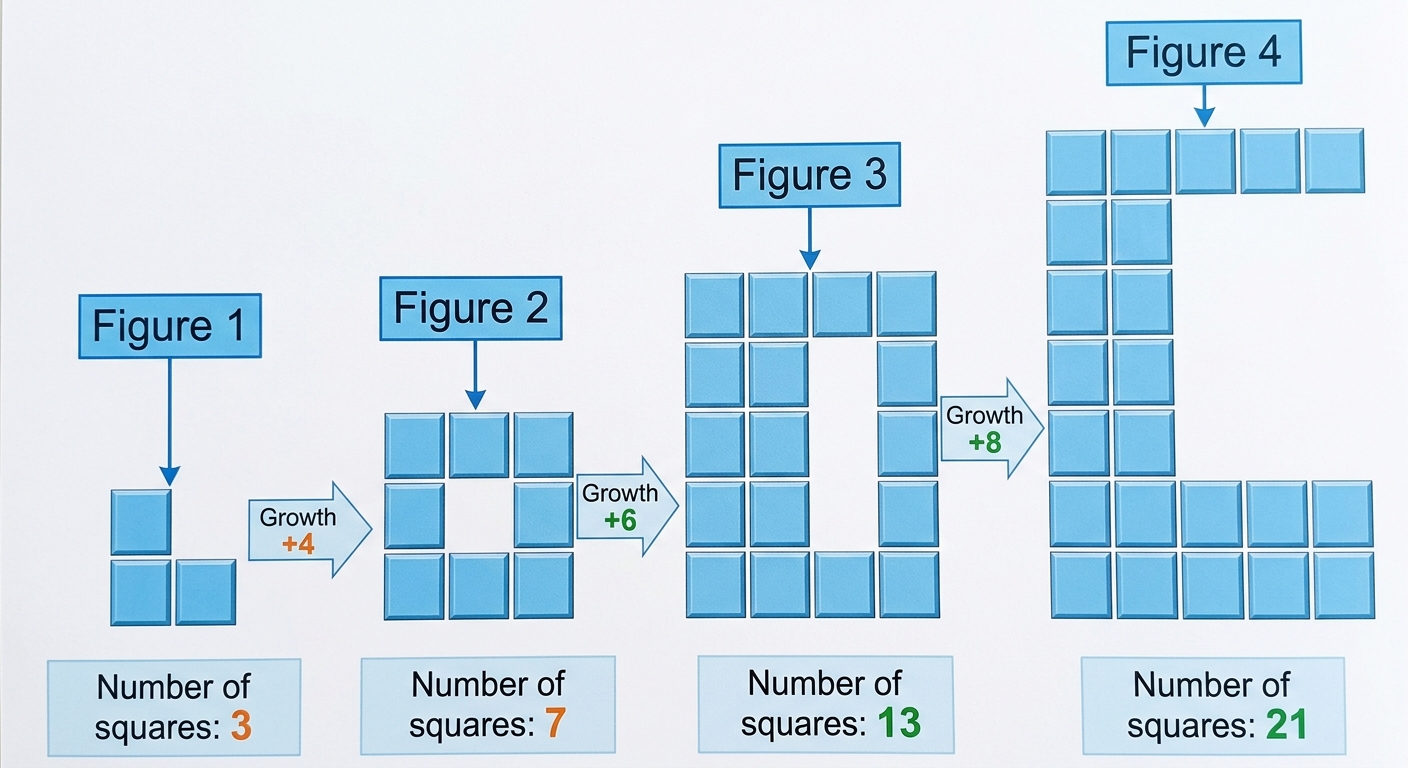
The diagram shows four figures in a pattern made from small squares arranged in an L-shape.
Figure 1 has 3 squares, Figure 2 has 7 squares, Figure 3 has 13 squares, Figure 4 has 21 squares.
Figure 1 has 3 squares, Figure 2 has 7 squares, Figure 3 has 13 squares, Figure 4 has 21 squares.
a
Find the number of squares added between consecutive figures, and hence deduce the number of squares in Figure 5. [3]
b
Show that the total number of squares in Figure is given by
by verifying the formula for and explaining how each term relates to the structure of the L-shape. [4]
by verifying the formula for and explaining how each term relates to the structure of the L-shape. [4]
c
Justify why no figure in this pattern can contain exactly 100 squares. [3]
Solutions
3QuestionCorrelation using technology (value and interpretation)Assessment Practice
10 marks~15 minCriterion C
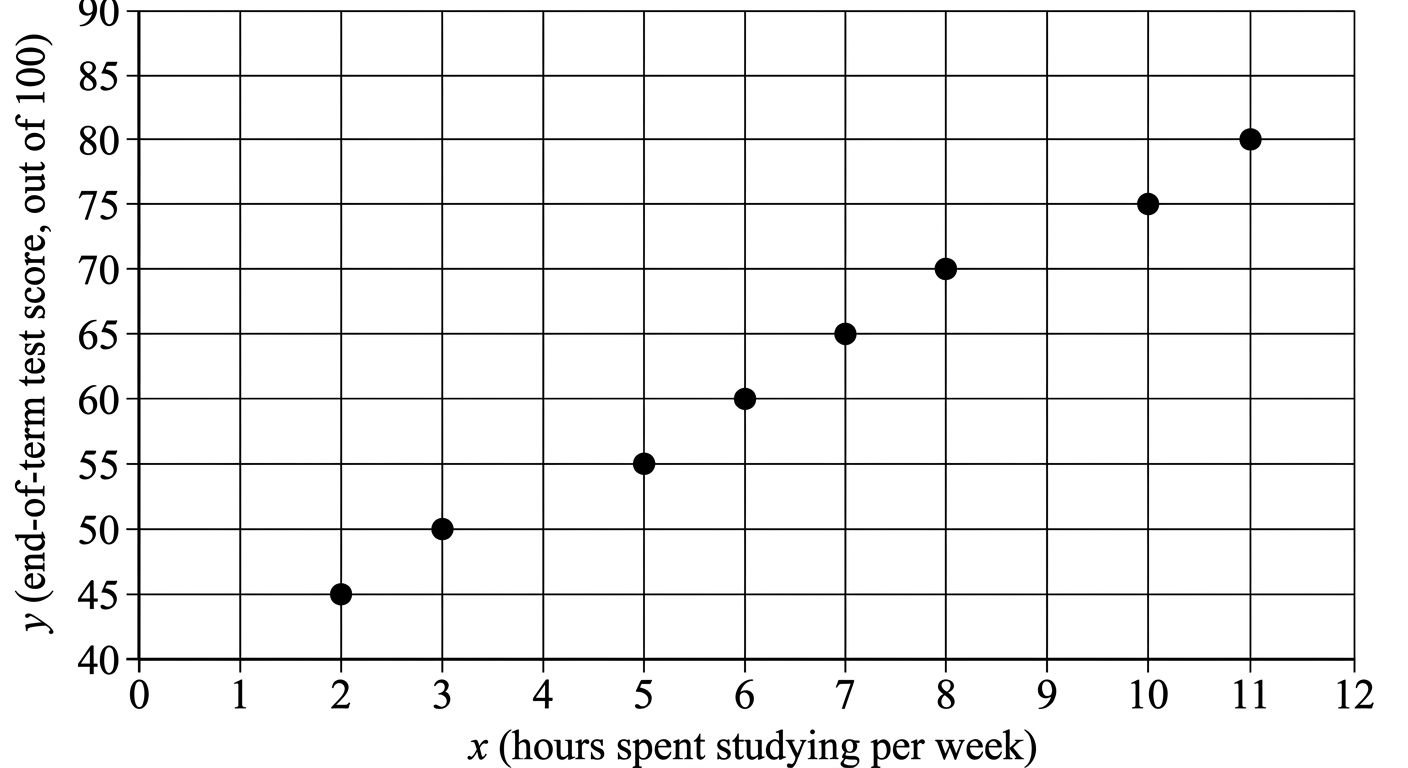
The table below shows the number of hours spent studying per week () and the end-of-term test score (, out of 100) for eight students.
(hours): 2, 3, 5, 6, 7, 8, 10, 11
(score): 45, 50, 55, 60, 65, 70, 75, 80
(hours): 2, 3, 5, 6, 7, 8, 10, 11
(score): 45, 50, 55, 60, 65, 70, 75, 80
a
Find the equation of the least-squares regression line of on , giving your answer in the form with and correct to 3 significant figures. [3]
b
A ninth student studied for 4 hours. Use your regression equation from part (a) to predict their test score. Hence determine whether this prediction is an interpolation or an extrapolation, and explain why this affects its reliability. [3]
c
A student claims: "Because the correlation coefficient is very close to 1, the regression line proves that studying more hours causes higher test scores." Critique this claim, identifying one mathematical reason and one contextual reason why it is not fully justified. [4]
Solutions
4QuestionCorrelation using technology (value and interpretation)Assessment Practice
11 marks~17 minCriterion A
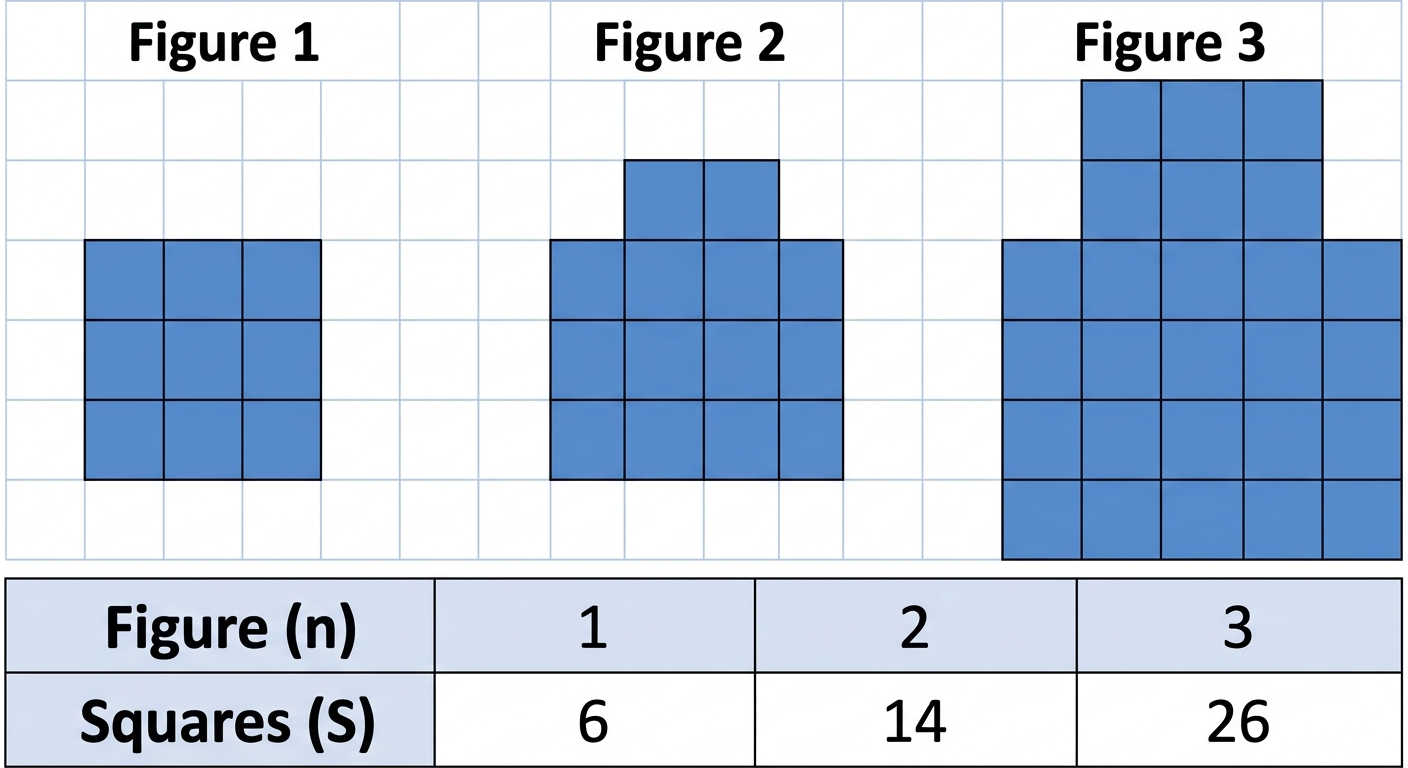
A student records the number of unit squares in each figure of a growing pattern. The diagram shows Figures 1, 2, and 3.
The number of unit squares in Figure follows a rule of the form
where , , and are integers.
A second pattern has the rule .
The number of unit squares in Figure follows a rule of the form
where , , and are integers.
| Figure () | 1 | 2 | 3 |
|---|---|---|---|
| Squares () | 6 | 14 | 26 |
A second pattern has the rule .
a
Find the values of , , and . [3]
b
Show that when , and find the figure number that first contains more than 200 unit squares. [4]
c
A designer claims that both patterns will eventually produce figures with identical numbers of unit squares, and plans to use that figure number as a design checkpoint. Justify whether the designer's claim is valid, and interpret what your answer means for the design plan. [4]
Solutions
That's every free question here — 4 of 89.
+85 more questions, plus Mock Papers & Worksheets, are waiting in Premium.