You're viewing free preview questions — 4 questions previewing here — subscribe to unlock 114 more, plus the Full Question Bank, Mock Papers & Worksheets.Upgrade
Graphs and Data Representation — Free MYP5 Mathematics (Extended) Practice Questions

1QuestionData visualizations and infographicsAssessment Practice
5 marks~8 minCriterion A
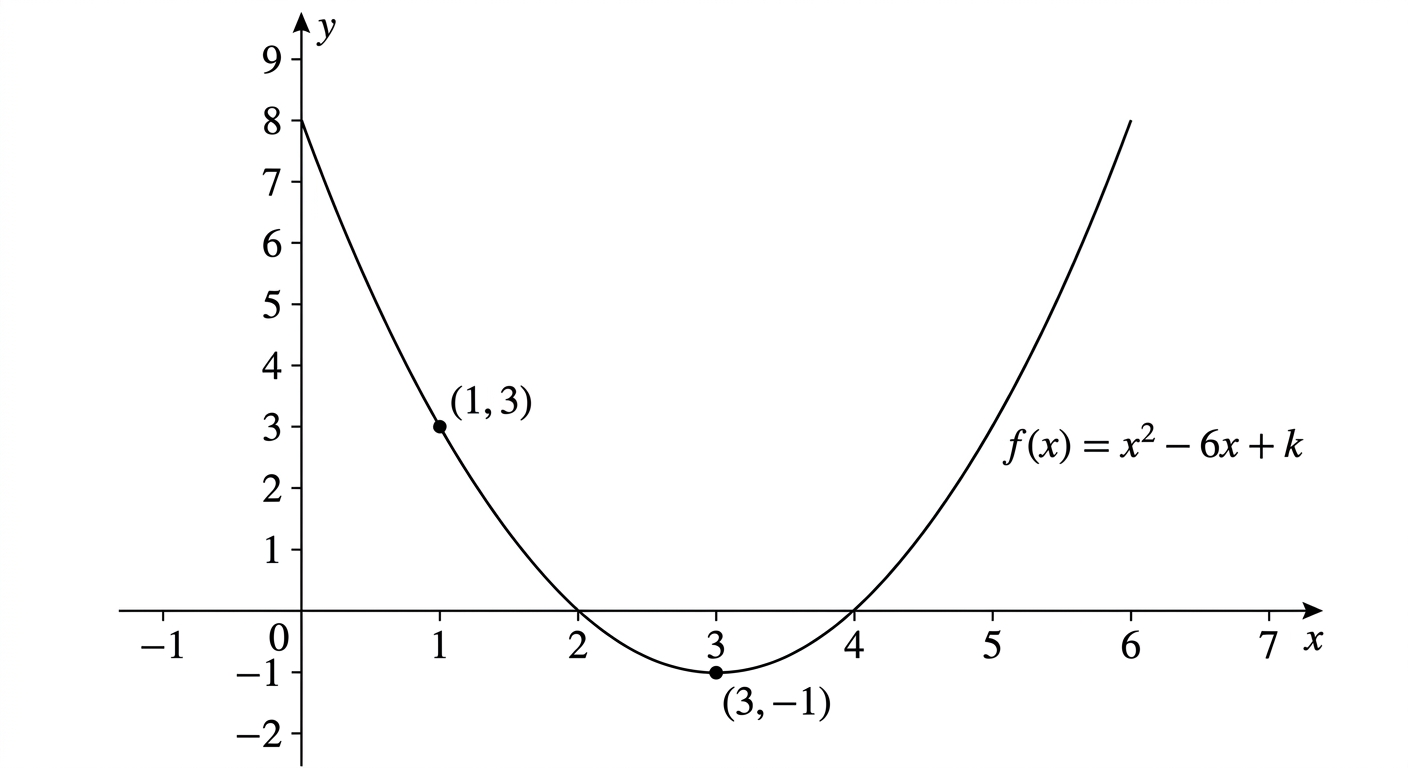
The diagram shows the graph of for , where is a constant. The graph passes through the point .
a
Show that . [1]
b
Find the coordinates of the vertex of the graph. [2]
c
State the values of for which has exactly one solution in the domain , and justify your answer. [2]

Solutions
2QuestionData visualizations and infographicsAssessment Practice
6 marks~9 minCriterion C
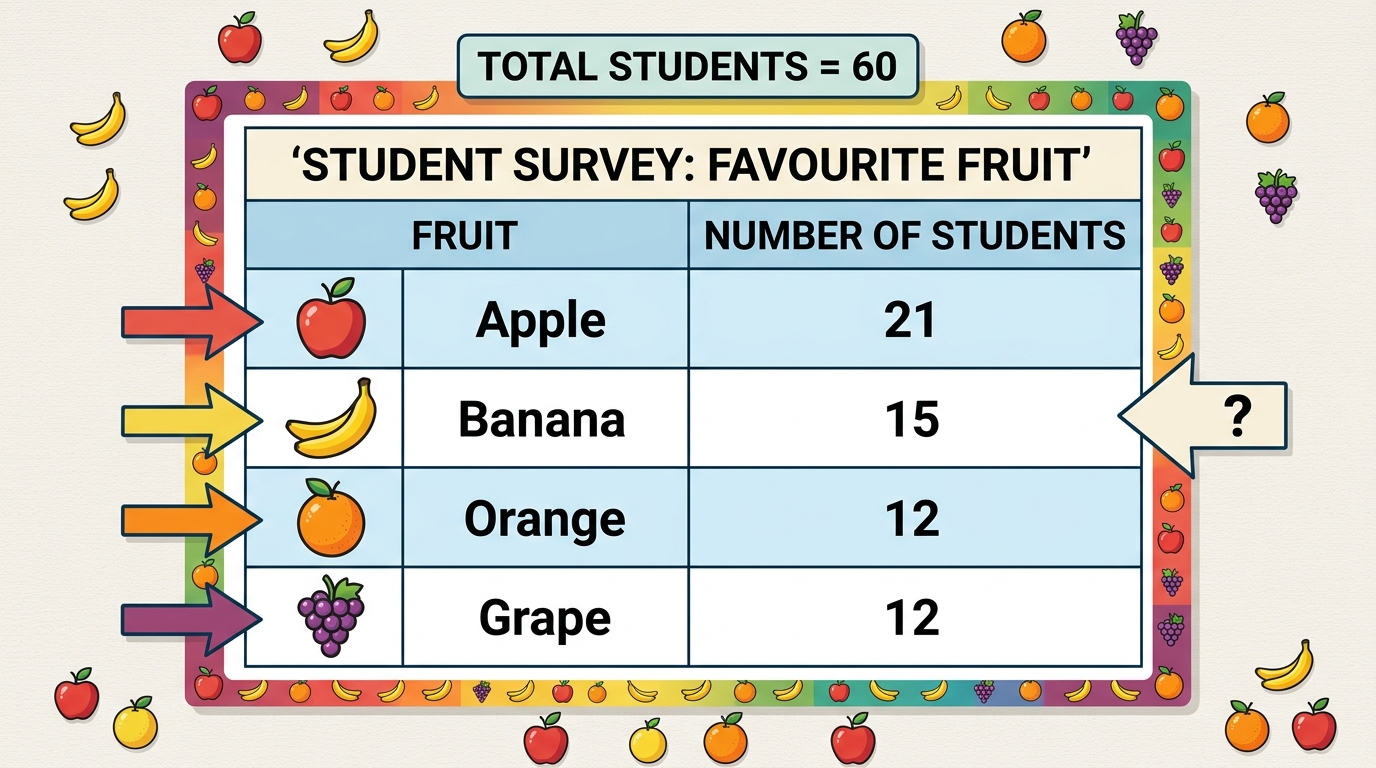
A group of 60 students were asked to choose their favourite fruit. The results are shown below.
| Fruit | Apple | Banana | Orange | Grape |
|---|---|---|---|---|
| Students | 21 | 15 | 12 | 12 |
a
Show that the sector angle for Apple in a pie chart is . [1]
b
A student claims that the combined sector angle for Banana and Orange equals the sector angle for Apple. Determine whether this claim is correct, showing all working. [2]
c
Two students are chosen at random from the group, one after the other, without replacement. The probability that both students chose Apple is . Justify whether this result suggests that Apple is a genuinely popular choice among the group, or whether it could reasonably be explained by chance. [3]
Solutions
3QuestionData visualizations and infographicsAssessment Practice
6 marks~9 minCriterion B
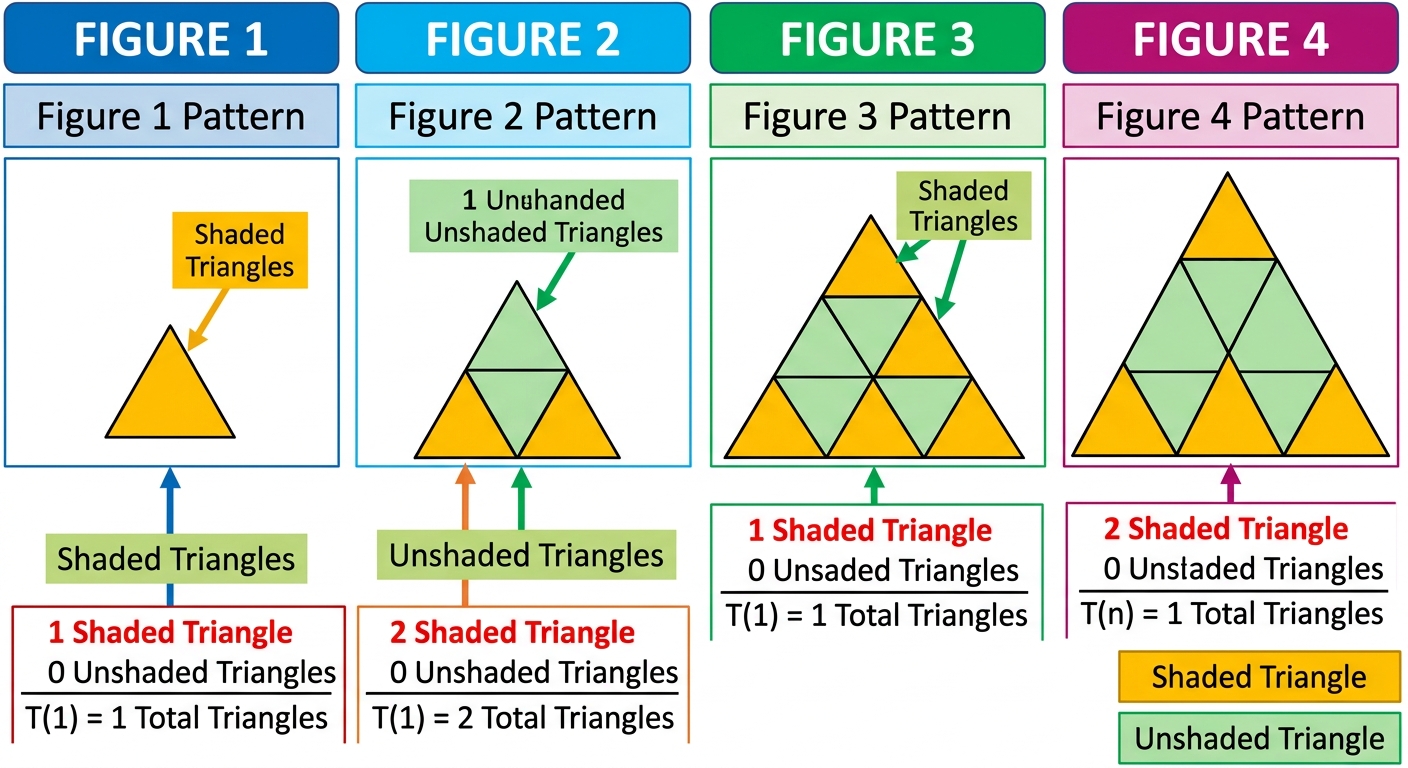
The diagram shows Figures 1 to 4 of a pattern made from small equilateral triangles.
The total number of small triangles in Figure is denoted .
| Figure 1 | 1 shaded triangle | 0 unshaded triangles. |
|---|---|---|
| Figure 2 | 2 shaded triangles | 1 unshaded triangle. |
| Figure 3 | 3 shaded triangles | 3 unshaded triangles. |
| Figure 4 | 4 shaded triangles | 6 unshaded triangles. |
The total number of small triangles in Figure is denoted .
a
Write down the values of , , , and . [1]
b
Find a rule for in the form
where and are constants to be determined. [3]
where and are constants to be determined. [3]
c
The number of unshaded triangles in Figure is given by
Using your rule from part (b), deduce a simplified expression for the number of shaded triangles in Figure , and justify why must always equal . [2]
Using your rule from part (b), deduce a simplified expression for the number of shaded triangles in Figure , and justify why must always equal . [2]
Solutions
4QuestionData visualizations and infographicsAssessment Practice
7 marks~11 minCriterion D
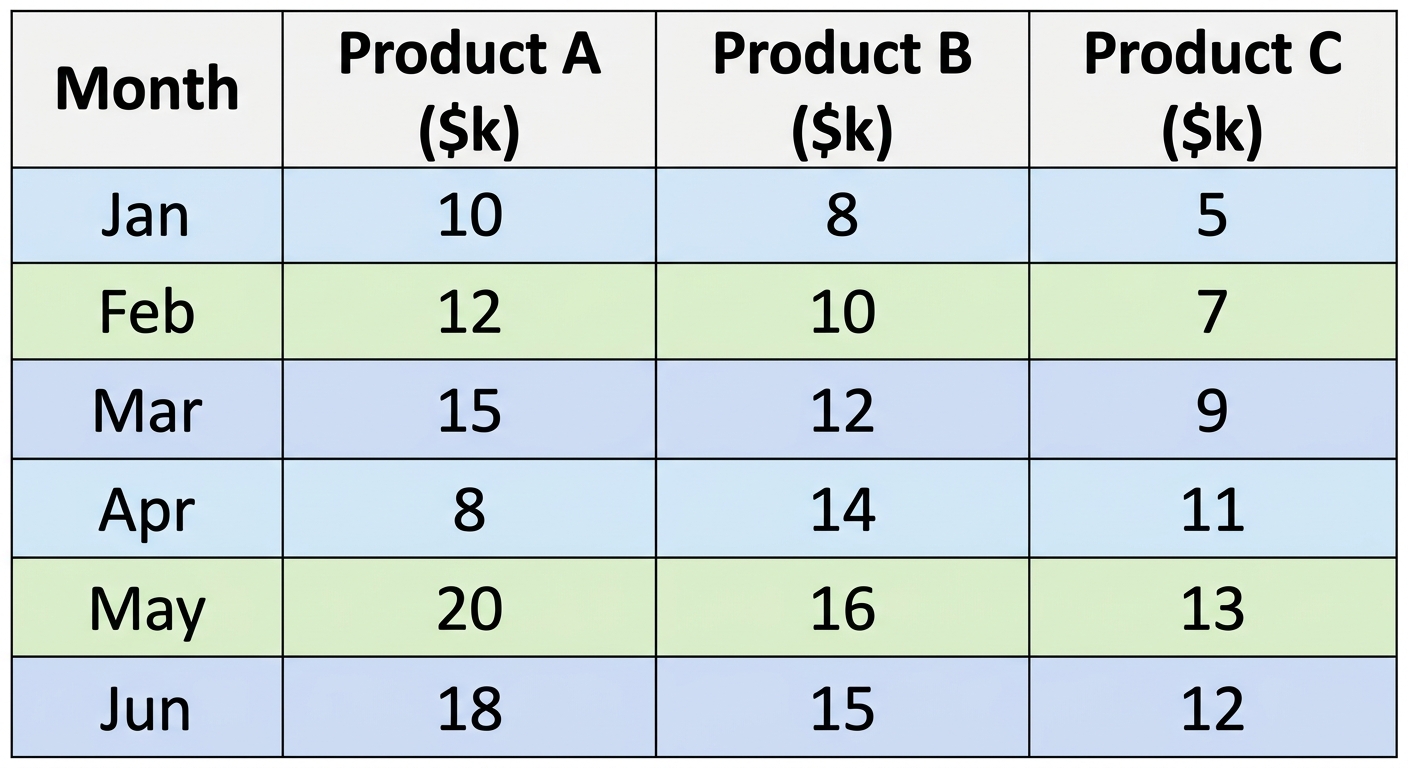
The table below shows monthly sales (in thousands of dollars) for three products over six months.
| Month | Jan | Feb | Mar | Apr | May | Jun |
|---|---|---|---|---|---|---|
| Product A | 10 | 12 | 15 | 8 | 20 | 18 |
| Product B | 8 | 10 | 12 | 14 | 16 | 15 |
| Product C | 5 | 7 | 9 | 11 | 13 | 12 |
a
Calculate the total sales for Product C over the six months, and hence find the overall total sales across all products and all months. [2]
b
A rival company claims that Product C accounts for more than 27% of total sales over the six months. Deduce whether this claim is correct, showing all working. [2]
c
The company sets a target: in a seventh month, Product A must achieve sales high enough so that Product A's share of the new seven-month overall total exceeds 40%. Products B and C each sell 15 thousand dollars in month 7. Find the minimum integer value of Product A's month-7 sales (in thousands of dollars) that meets this target, and justify whether this target is a realistic expectation for Product A based on its six-month sales record. [3]
Solutions
That's every free question here — 4 of 118.
+114 more questions, plus Mock Papers & Worksheets, are waiting in Premium.