You're viewing free preview questions — 4 questions previewing here — subscribe to unlock 99 more, plus the Full Question Bank, Mock Papers & Worksheets.Upgrade
Measures of Dispersion — Free MYP5 Mathematics (Extended) Practice Questions

1QuestionBox and Whisker Plots for Spread of DataConcept Practice
4 marks~6 minCriterion A
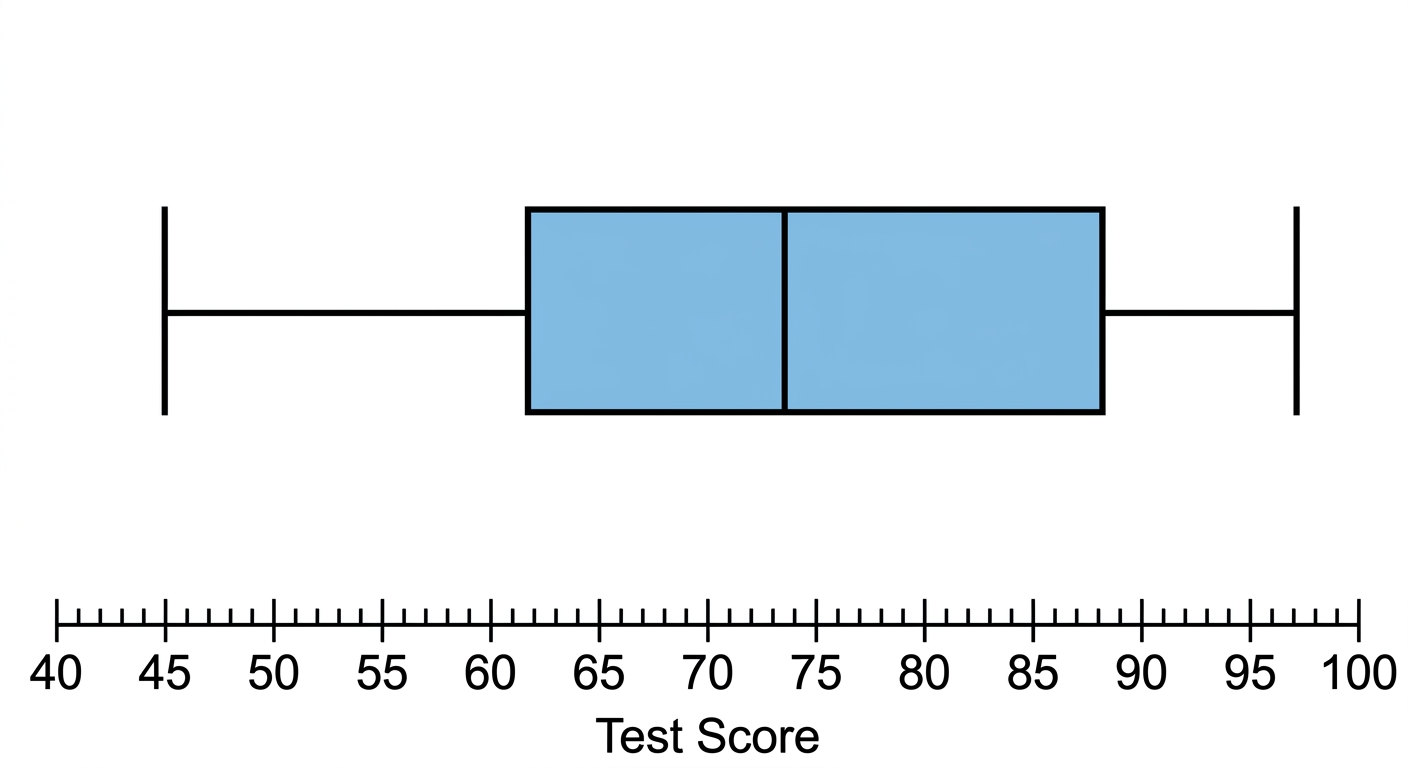
A school's sports coordinator records the sprint times (in seconds) of 30 students during a fitness assessment. The box-and-whisker plot displays the results, with the following five-number summary:
Minimum s, s, Median s, s, Maximum s
Students who score within 4 seconds of the median are classified as "consistent performers."
Minimum s, s, Median s, s, Maximum s
Students who score within 4 seconds of the median are classified as "consistent performers."
a
Calculate the range of the sprint times. [1]
b
Calculate the interquartile range (IQR) of the sprint times. [1]
c
Justify whether the middle 50% of students qualify as consistent performers, using the IQR. [2]

Solutions
2QuestionComparing Variability Between Data SetsAssessment Practice
4 marks~6 minCriterion C
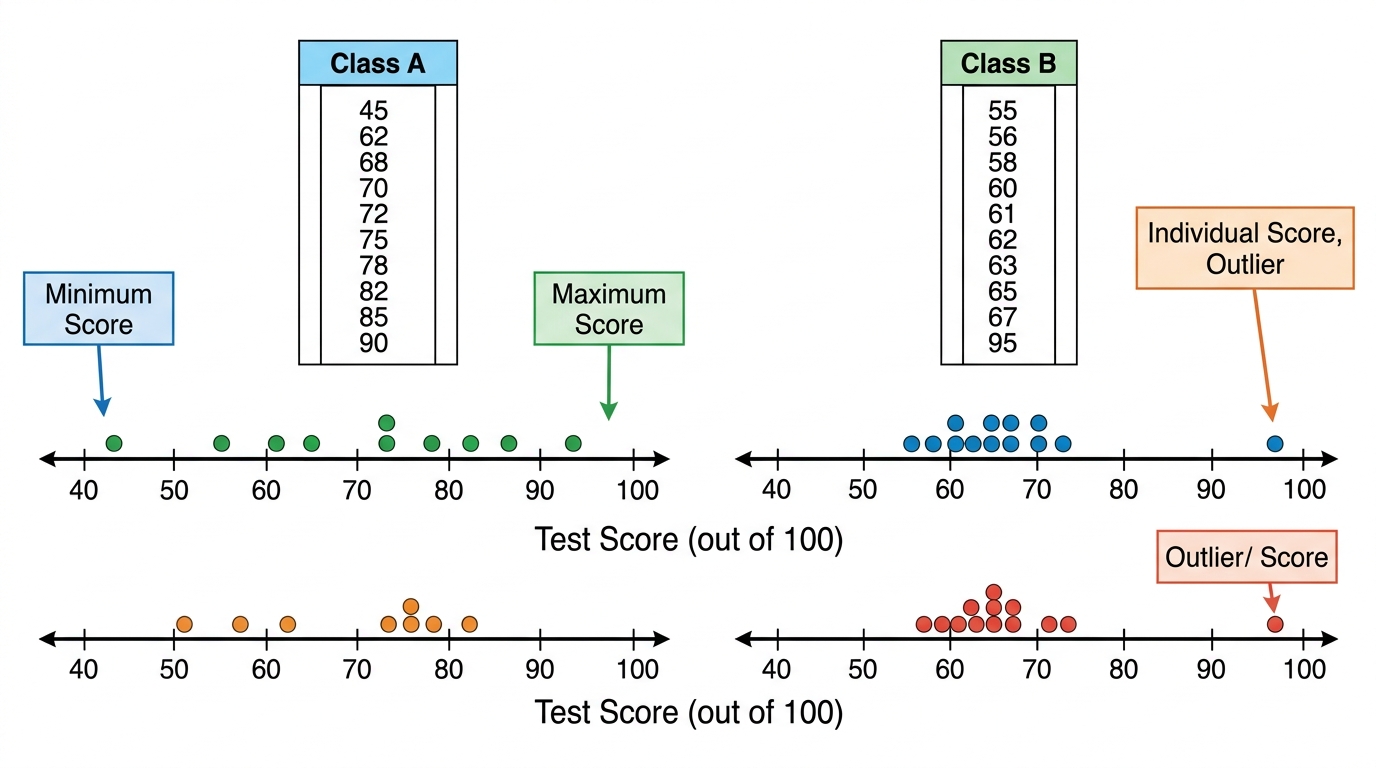
A school is comparing the consistency of test scores between two Grade 10 classes. The scores (out of 100) are:
Class A: 45, 62, 68, 70, 72, 75, 78, 82, 85, 90
Class B: 55, 56, 58, 60, 61, 62, 63, 65, 67, 95
Class A: 45, 62, 68, 70, 72, 75, 78, 82, 85, 90
Class B: 55, 56, 58, 60, 61, 62, 63, 65, 67, 95
a
Calculate the range for each class. [1]
b
Calculate the interquartile range (IQR) for each class. [2]
c
The school principal concludes that Class B is more consistent because its range is smaller than Class A's. Critique this conclusion, referring to the IQR values and the effect of the outlier in Class B. [1]
Solutions
3QuestionRange and standard deviationAssessment Practice
6 marks~9 minCriterion B
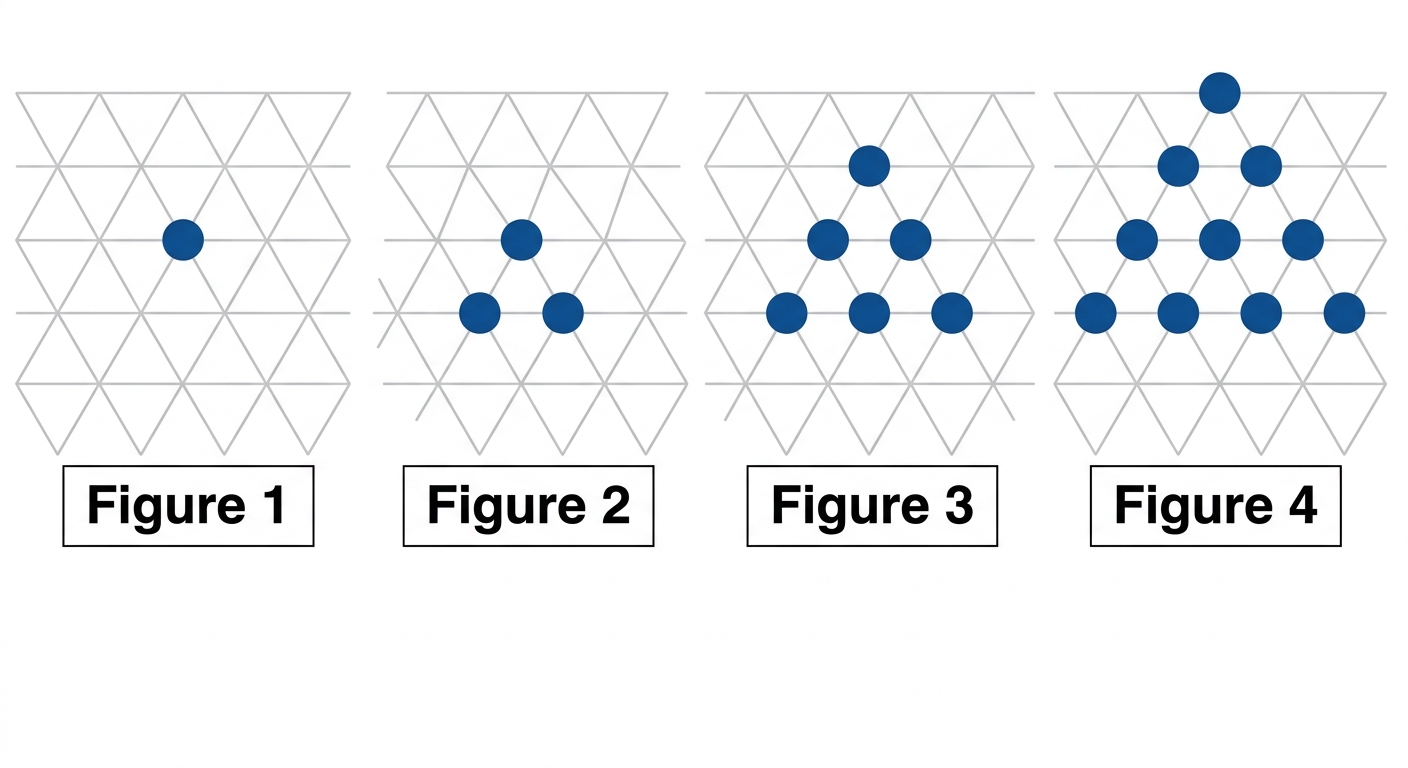
The diagram shows Figures 1 to 4 of a pattern made from dots arranged in a triangular grid.
Figure 1 has 1 dot, Figure 2 has 3 dots, Figure 3 has 6 dots, and Figure 4 has 10 dots.
Figure 1 has 1 dot, Figure 2 has 3 dots, Figure 3 has 6 dots, and Figure 4 has 10 dots.
a
Write down the number of dots added when going from Figure 3 to Figure 4. [1]
b
Find a rule for the number of dots in Figure , giving your answer in the form
Verify your rule for Figure 3. [3]
Verify your rule for Figure 3. [3]
c
A student claims that Figure 16 is the first figure in the pattern to contain more than 100 dots. Justify whether the student is correct. [2]
Solutions
4QuestionCalculating the interquartile rangeAssessment Practice
6 marks~9 minCriterion D
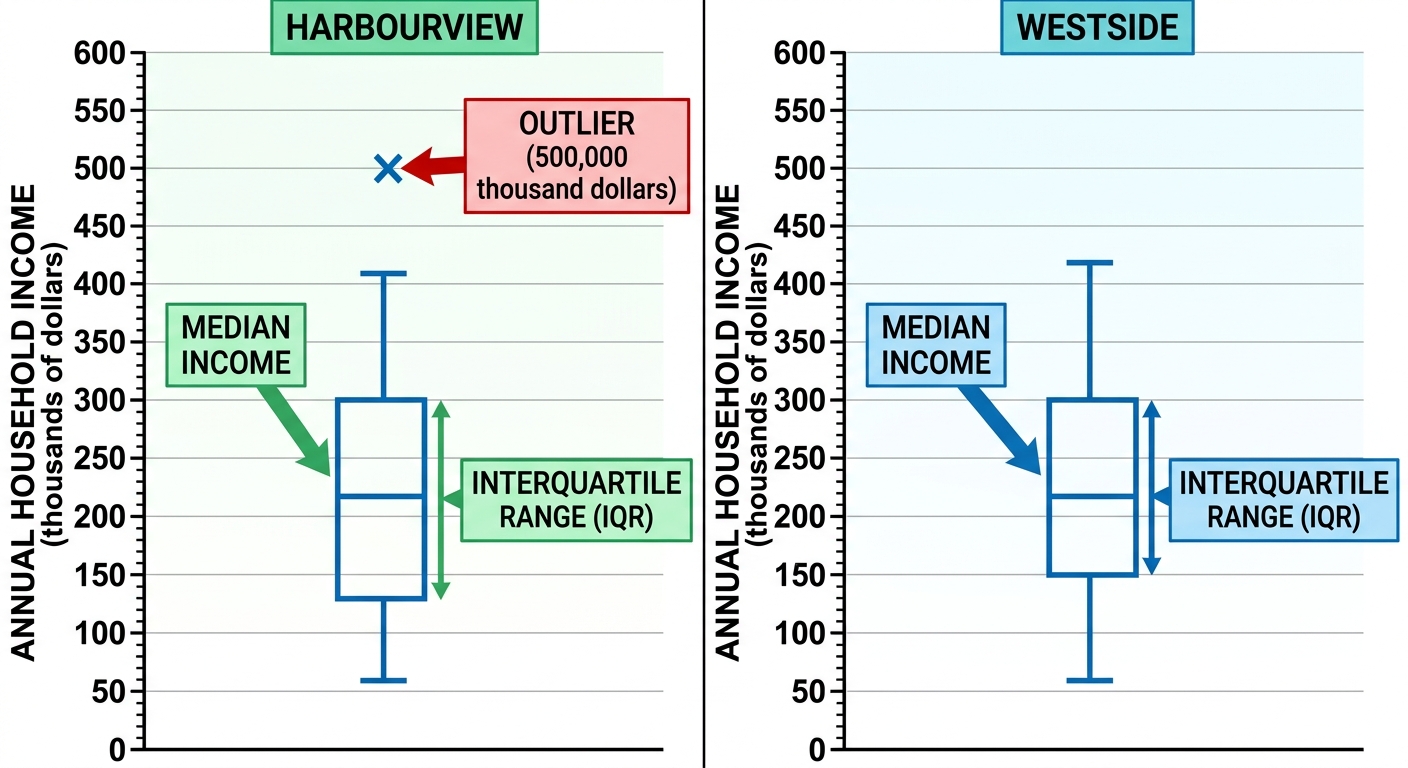
A city council collects annual household income data (in thousands of dollars) for two neighbourhoods.
Harbourview (15 households, sorted):
35, 42, 48, 51, 53, 55, 58, 62, 65, 68, 72, 78, 85, 92, 500 000
Westside (15 households, sorted):
30, 33, 36, 39, 42, 45, 48, 51, 54, 57, 60, 63, 66, 69, 72
The mean household income for Harbourview is approximately 33 393 thousand dollars and the standard deviation is approximately 128 924 thousand dollars.
Harbourview (15 households, sorted):
35, 42, 48, 51, 53, 55, 58, 62, 65, 68, 72, 78, 85, 92, 500 000
Westside (15 households, sorted):
30, 33, 36, 39, 42, 45, 48, 51, 54, 57, 60, 63, 66, 69, 72
The mean household income for Harbourview is approximately 33 393 thousand dollars and the standard deviation is approximately 128 924 thousand dollars.
a
Calculate the interquartile range (IQR) for each neighbourhood. [2]
b
Justify which pair of summary statistics — median and IQR, or mean and standard deviation — better represents the typical household income in Harbourview. [2]
c
Advise the council whether the IQR alone is sufficient for comparing income spread across neighbourhoods when allocating social services funding, referring to the Harbourview data. [2]
Solutions
That's every free question here — 4 of 103.
+99 more questions, plus Mock Papers & Worksheets, are waiting in Premium.