You're viewing free preview questions — 4 questions previewing here — subscribe to unlock 368 more, plus the Full Question Bank, Mock Papers & Worksheets.Upgrade
Probability Rules and Tree Diagrams — Free MYP5 Mathematics (Extended) Practice Questions

1QuestionSet Notation and Venn Diargram NotationsConcept Practice
6 marks~9 minCriterion A
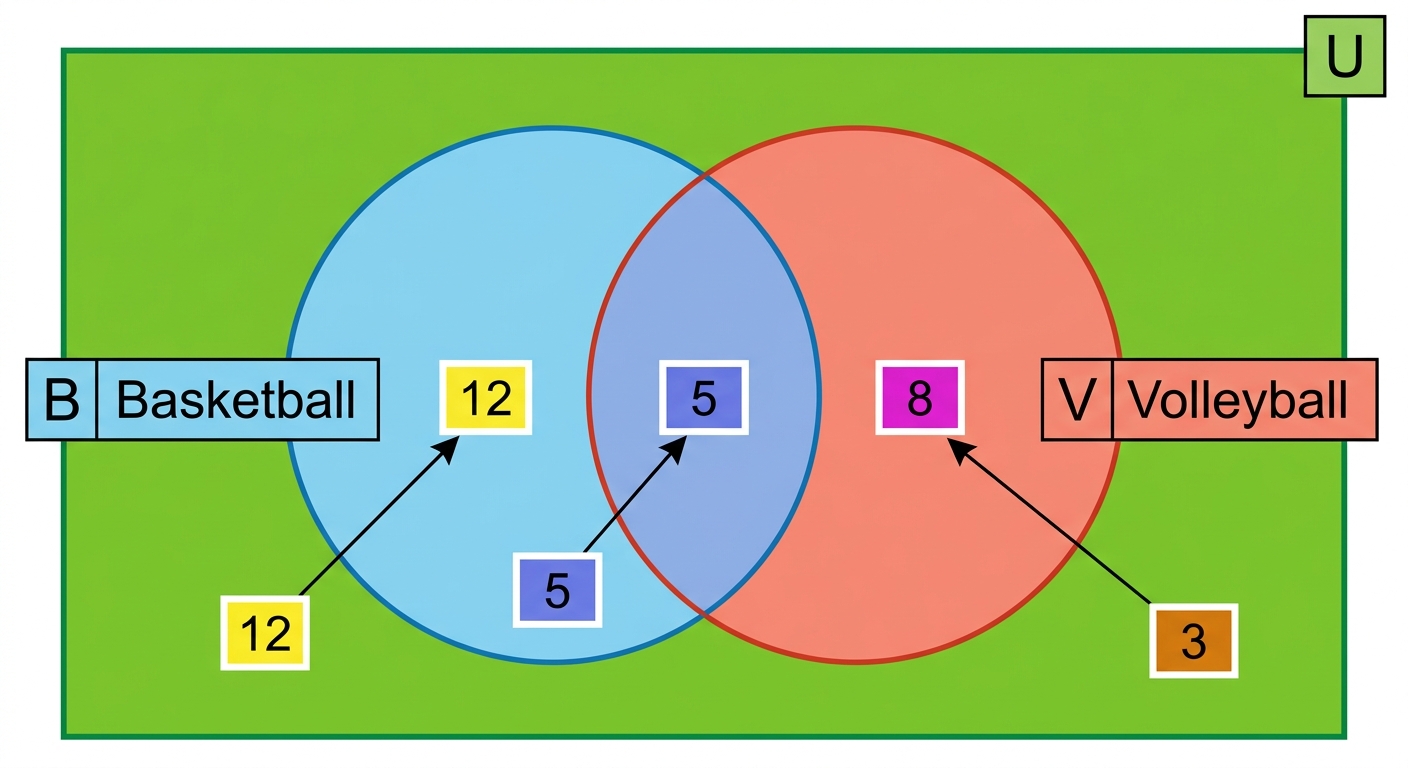
A school records which sports students play. The Venn diagram shows the number of students in a class who play basketball () and/or volleyball ():
- Only basketball: 12
- Only volleyball: 8
- Both sports: 5
- Neither sport: 3
- Only basketball: 12
- Only volleyball: 8
- Both sports: 5
- Neither sport: 3
a
Calculate . [2]
b
A student is chosen at random from the class. Deduce the probability that this student plays exactly one of the two sports, expressing your answer using appropriate set notation. [2]
c
The school requires that more than 70% of the class participate in at least one sport to qualify for an inter-school tournament. Justify whether this class qualifies, supporting your answer with a calculation. [2]

Solutions
2QuestionCalculating Combined ProbabilitiesAssessment Practice
2 marks~3 minCriterion D
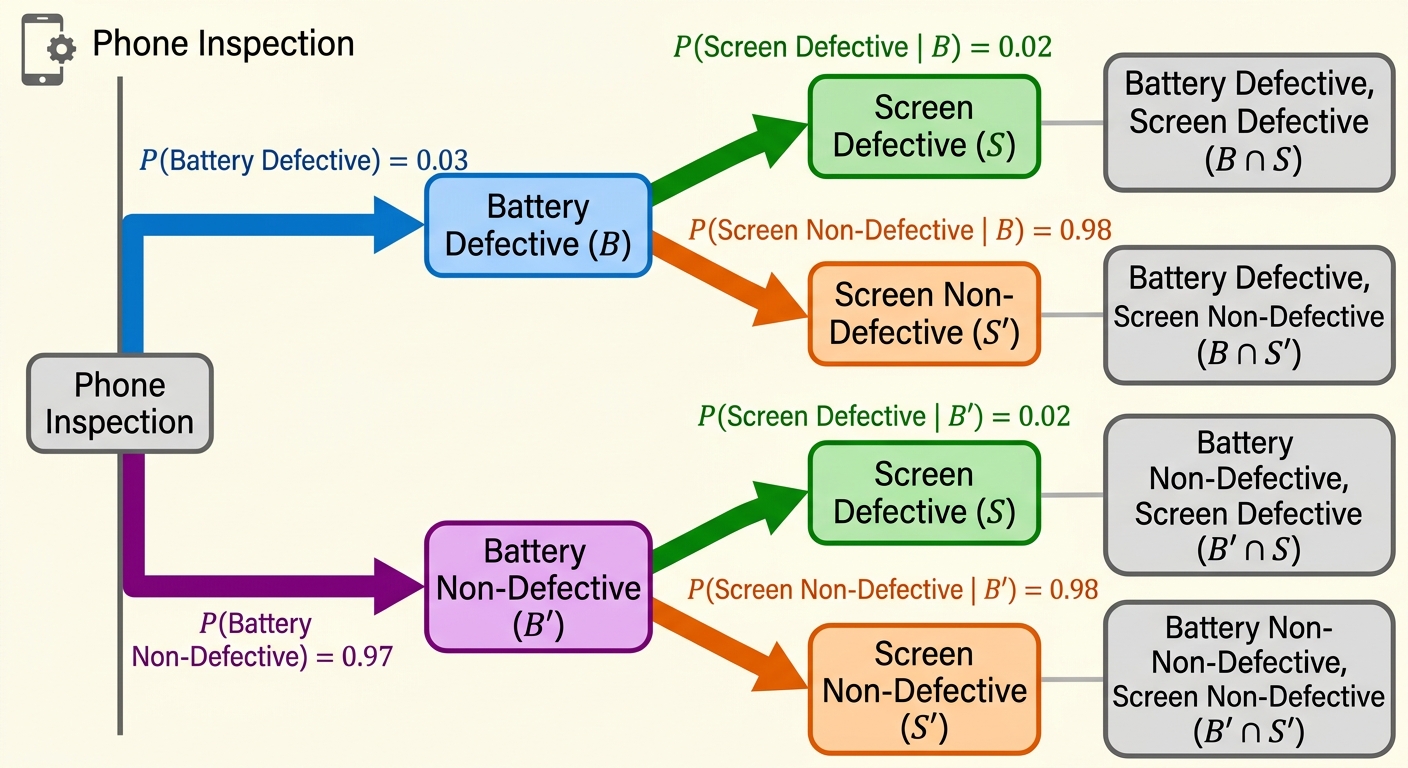
A quality control inspector tests two independent components in a smartphone: the battery and the screen. The probability that a battery is defective is ; the probability that a screen is defective is . The factory's acceptance threshold states that no more than of phones should have at least one defective component.
a
Calculate the probability that a randomly selected phone has at least one defective component. [1]
b
Justify whether this production line meets the factory's acceptance threshold, and identify one reason why the independence assumption may not hold in a real assembly line. [1]
Solutions
3QuestionSolving Problems using tree diagrams and Venn DiagramsAssessment Practice
6 marks~9 minCriterion C
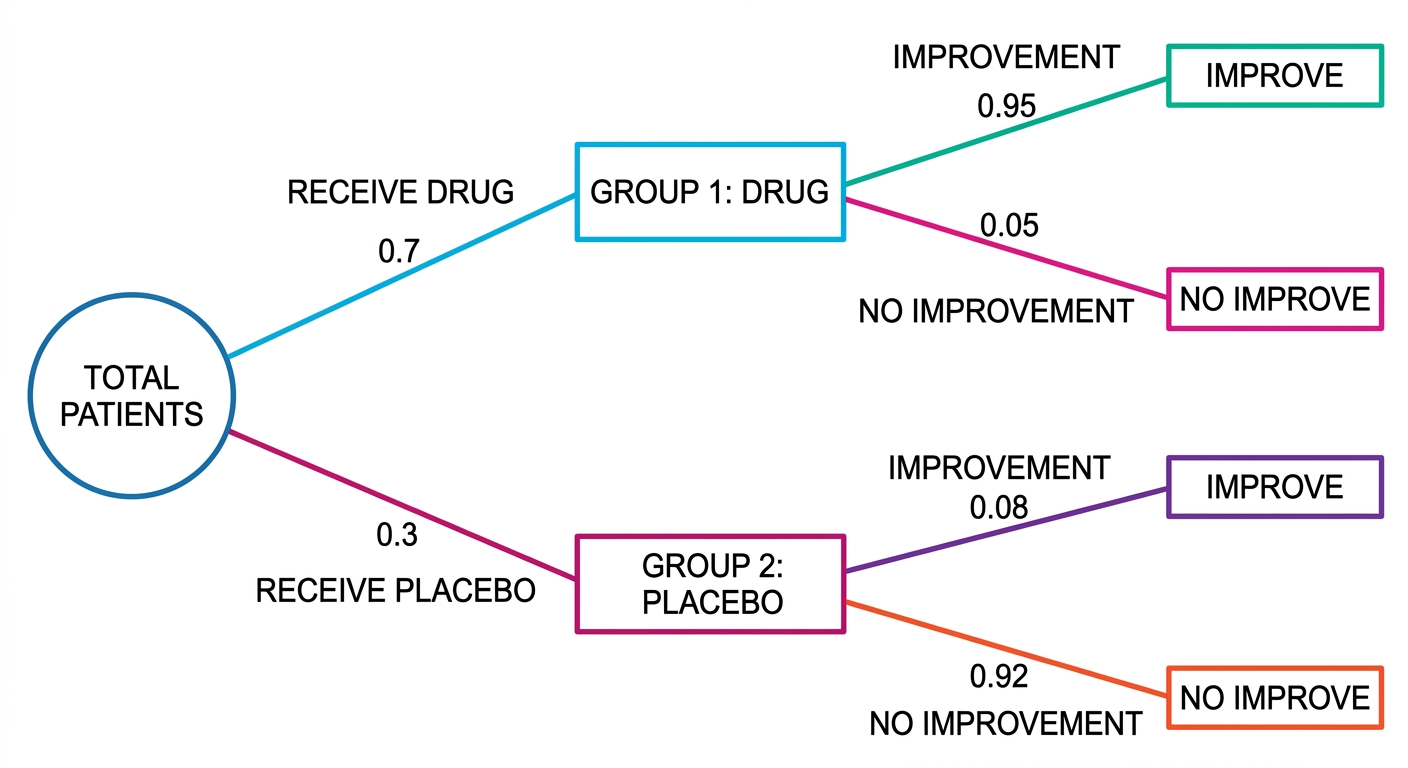
A pharmaceutical company conducts a clinical trial for a new drug. In the trial, 70% of patients receive the drug and 30% receive a placebo. Of those receiving the drug, 95% show improvement. Of those receiving the placebo, 8% show improvement.
a
Construct a tree diagram to represent this situation, labelling all branches with their probabilities. [2]
b
Determine the probability that a randomly selected patient shows improvement. [2]
c
A patient selected at random has shown improvement. The pharmaceutical company claims this result confirms the drug is highly effective. Using your calculated probability, advise the company on whether this claim is justified. [2]
Solutions
4QuestionMutually exclusive eventsAssessment Practice
6 marks~9 minCriterion B
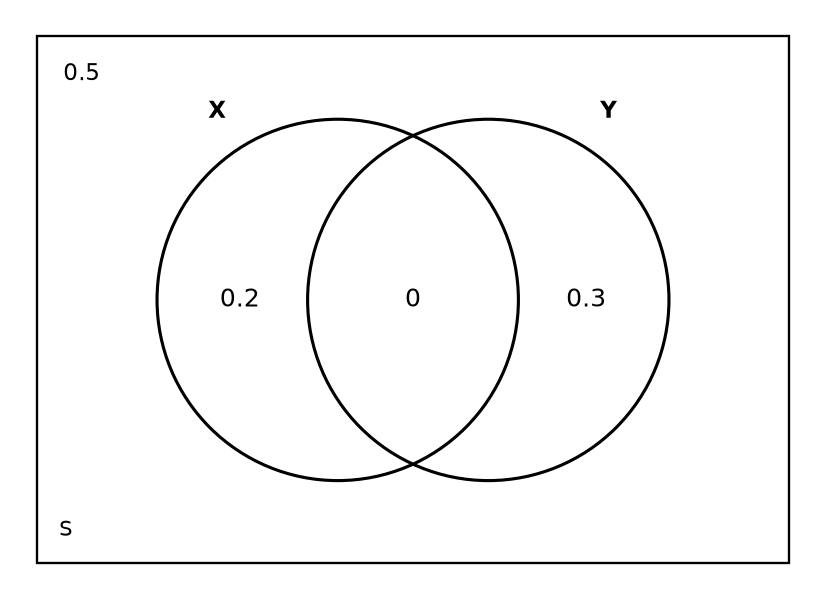
The Venn diagram shows two mutually exclusive events and inside a sample space .
Three figures each give a pair of mutually exclusive events with their probabilities.
Three figures each give a pair of mutually exclusive events with their probabilities.
| Figure 1 | ||
|---|---|---|
| Figure 2 | ||
| Figure 3 |
a
State the value of for any pair of mutually exclusive events, and explain what this means in context. [1]
b
Find for each figure. Record your results below, then describe the pattern you observe between , , and .
| Figure 1 | ? | ||
|---|---|---|---|
| Figure 2 | ? | ||
| Figure 3 | ? [2] |
c
A fourth pair of mutually exclusive events has and . Find , and hence justify whether there is sufficient probability remaining in the sample space for a third mutually exclusive event with . [3]
Solutions
That's every free question here — 4 of 372.
+368 more questions, plus Mock Papers & Worksheets, are waiting in Premium.