You're viewing free preview questions — 4 questions previewing here — subscribe to unlock 63 more, plus the Full Question Bank, Mock Papers & Worksheets.Upgrade
Trigonometric Graphs and Transformations — Free MYP5 Mathematics (Extended) Practice Questions

1QuestionSketching Graphs of y = sin x cos x tan xConcept Practice
2 marks~3 minCriterion A
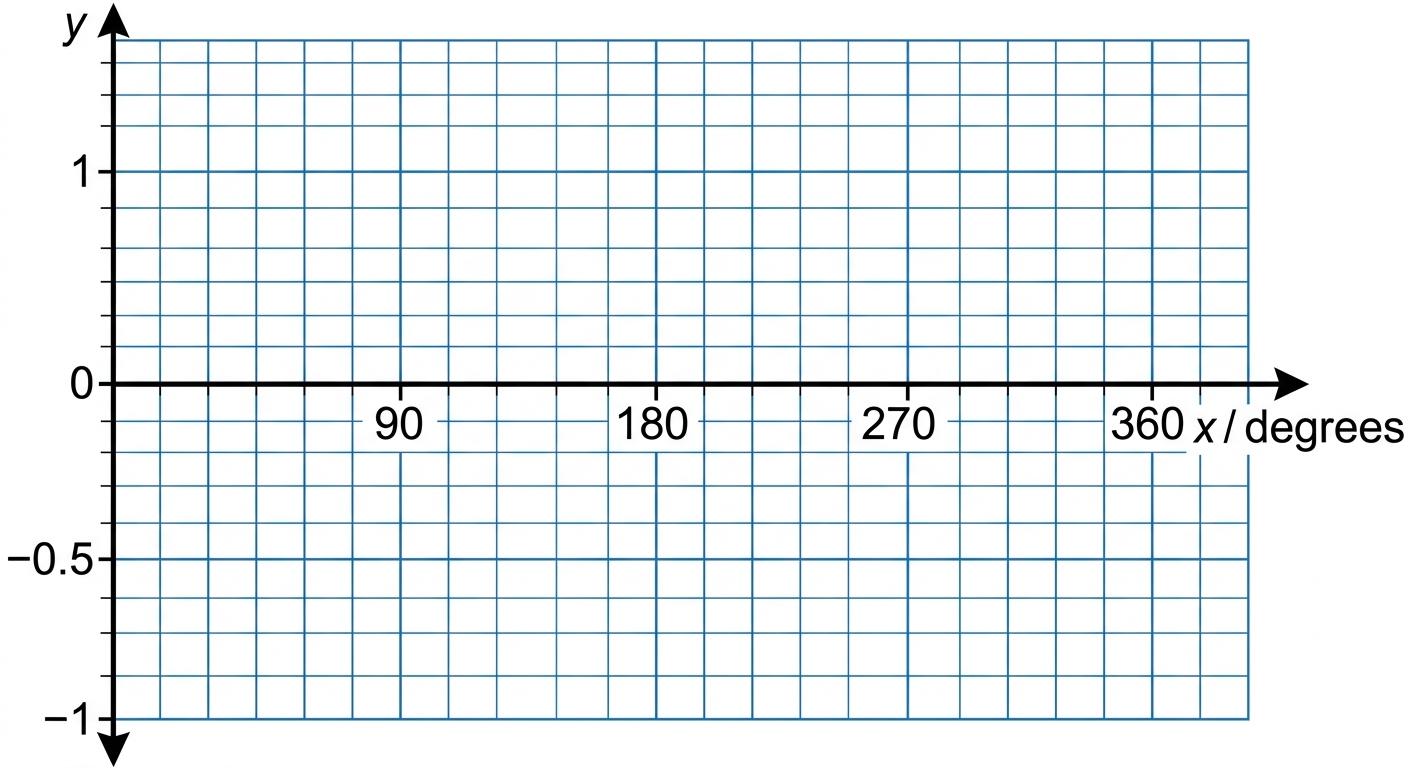
A coastal monitoring buoy records wave height. Engineers model the displacement (in metres) of the buoy from its rest position using , where represents time in degrees over one complete cycle from to .
a
State the amplitude and period of , and identify the coordinates of the maximum, minimum, and all intercepts over this cycle. [1]
b
Explain what the amplitude and the minimum value tell an engineer about the buoy's motion in this context. [1]

Solutions
2QuestionSketching Graphs of y = sin x cos x tan xAssessment Practice
3 marks~5 minCriterion C
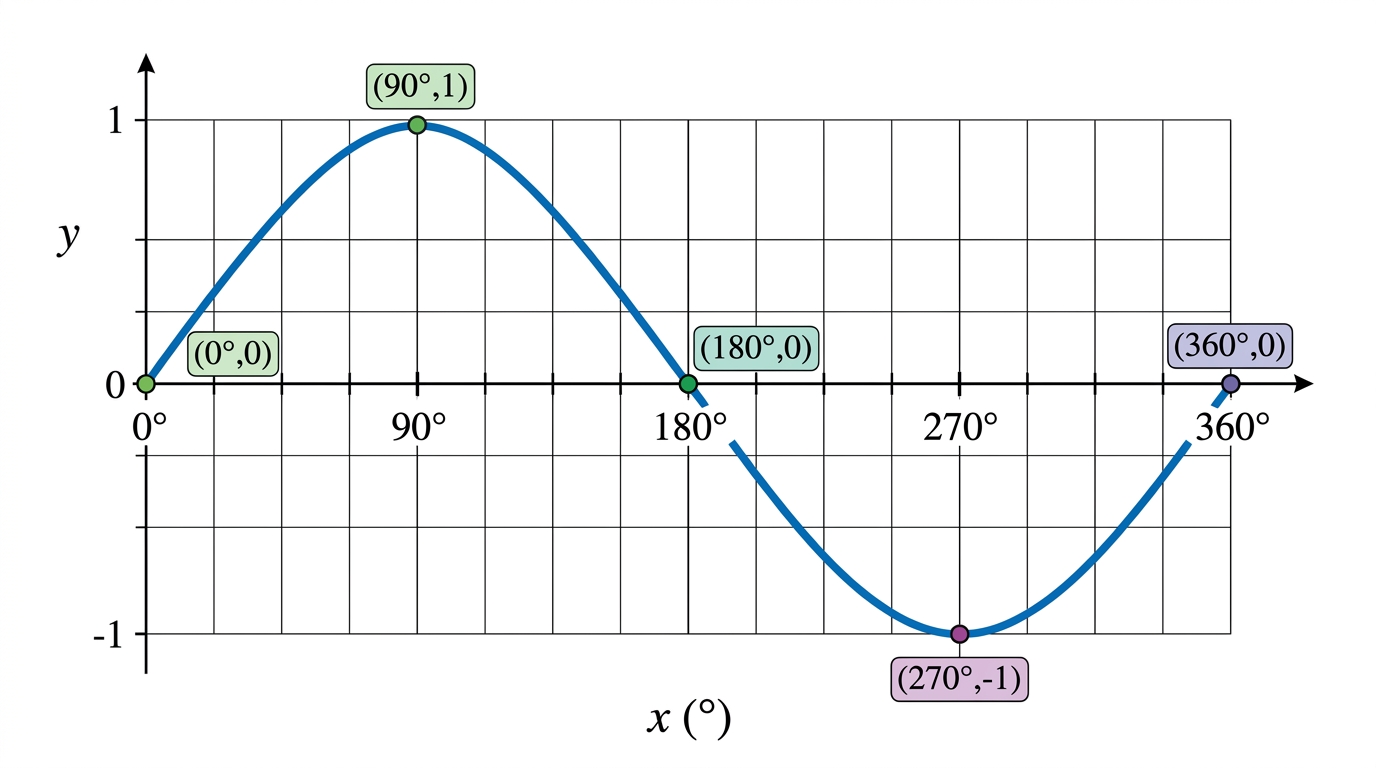
A sound engineer models the pressure wave of a pure musical tone using , where represents time in degrees over one complete cycle ().
The function passes through , , , , and .
The function passes through , , , , and .
a
Calculate , giving your answer in exact form. [1]
b
Deduce the values of and , using symmetry properties of the sine function. [1]
c
The engineer states: "The pressure wave is perfectly balanced — positive and negative peaks are equal in magnitude throughout the cycle." Using your results from (a) and (b), and the value , justify whether this statement is correct. [1]
Solutions
3QuestionGraphing Real-Life Periodic PhenomenaAssessment Practice
8 marks~12 minCriterion D
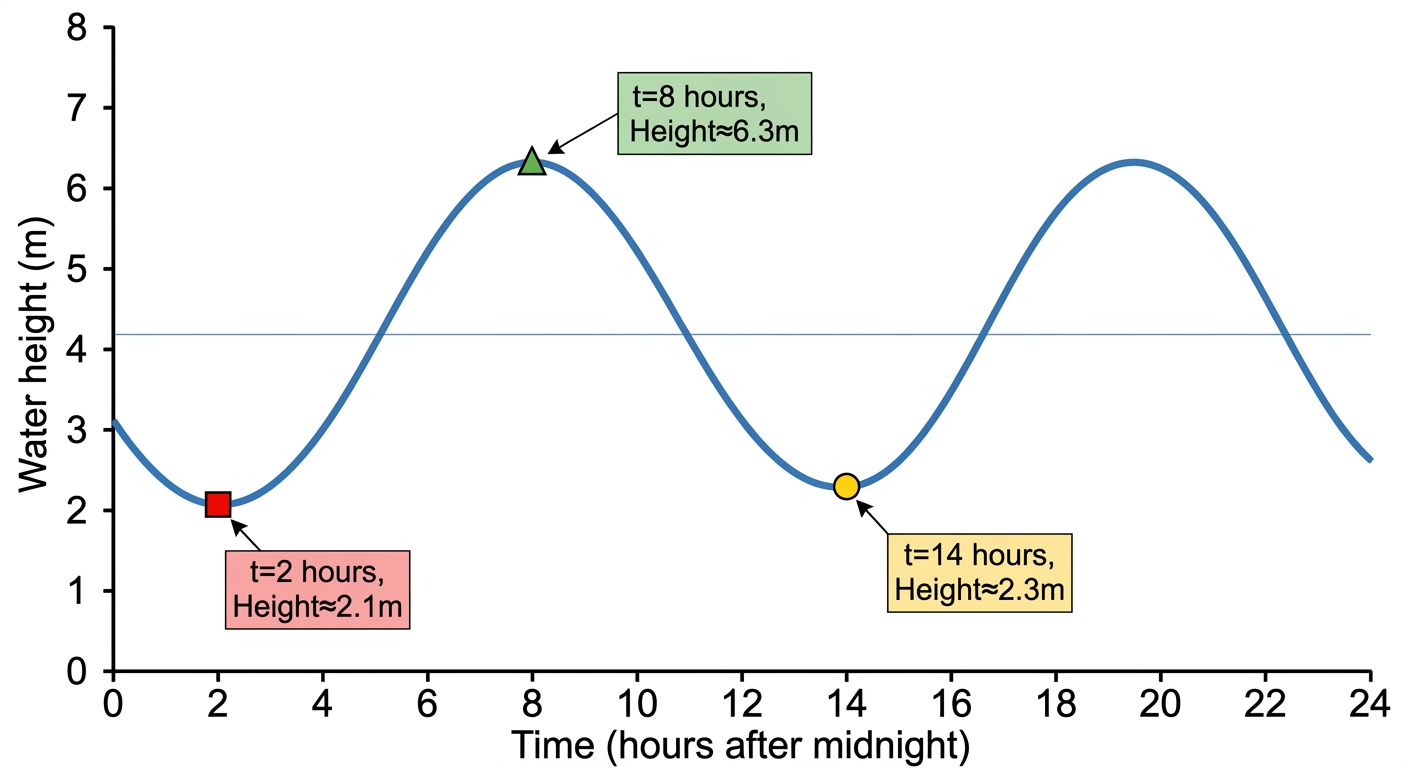
The water height at a harbour is modelled by
where is in metres and is hours after midnight.
Actual measurements:
(hours after midnight): 2, 8, 14
Actual (m): 2.1, 6.3, 2.3
where is in metres and is hours after midnight.
Actual measurements:
(hours after midnight): 2, 8, 14
Actual (m): 2.1, 6.3, 2.3
a
Calculate the predicted water height at , , and . Show all substitutions clearly. [3]
b
Calculate the percentage error at each time using
Show your working for each value. [3]
Show your working for each value. [3]
c
A fishing vessel requires a minimum water height of 3.8 m to enter the harbour safely. Advise the harbour master whether the model alone is sufficient to determine safe entry times, justifying your answer using the percentage errors from part (b). [2]
Solutions
4QuestionGraphing Real-Life Periodic PhenomenaAssessment Practice
6 marks~9 minCriterion B
The water depth (in metres) at a harbour is modelled over a 24-hour period. Measurements are taken every 2 hours.
The depth is modelled by , where is time in hours, is the amplitude, is related to the period by , and is the vertical shift.
| Time (h) | 0 | 2 | 4 | 6 | 8 | 10 | 12 | 14 | 16 | 18 | 20 | 22 |
|---|---|---|---|---|---|---|---|---|---|---|---|---|
| Depth (m) | 3.2 | 5.6 | 7.0 | 5.6 | 3.2 | 1.8 | 3.2 | 5.6 | 7.0 | 5.6 | 3.2 | 1.8 |
The depth is modelled by , where is time in hours, is the amplitude, is related to the period by , and is the vertical shift.
a
Justify that the period of the tidal cycle is 12 hours. [2]
b
Deduce the values of , , and , and write the complete model for . [2]
c
A vessel requires a minimum depth of 5.0 m to enter the harbour safely. Using your model, advise the harbour master whether the vessel can enter safely at hours, justifying your answer with a calculation. [2]
Solutions
That's every free question here — 4 of 67.
+63 more questions, plus Mock Papers & Worksheets, are waiting in Premium.