You're viewing free preview questions — 4 questions previewing here — subscribe to unlock 136 more, plus the Full Question Bank, Mock Papers & Worksheets.Upgrade
Vector Arithmetic and Scalar Multiplication — Free MYP5 Mathematics (Extended) Practice Questions

1QuestionAdding and Subtracting Column VectorsAssessment Practice
6 marks~9 minCriterion A
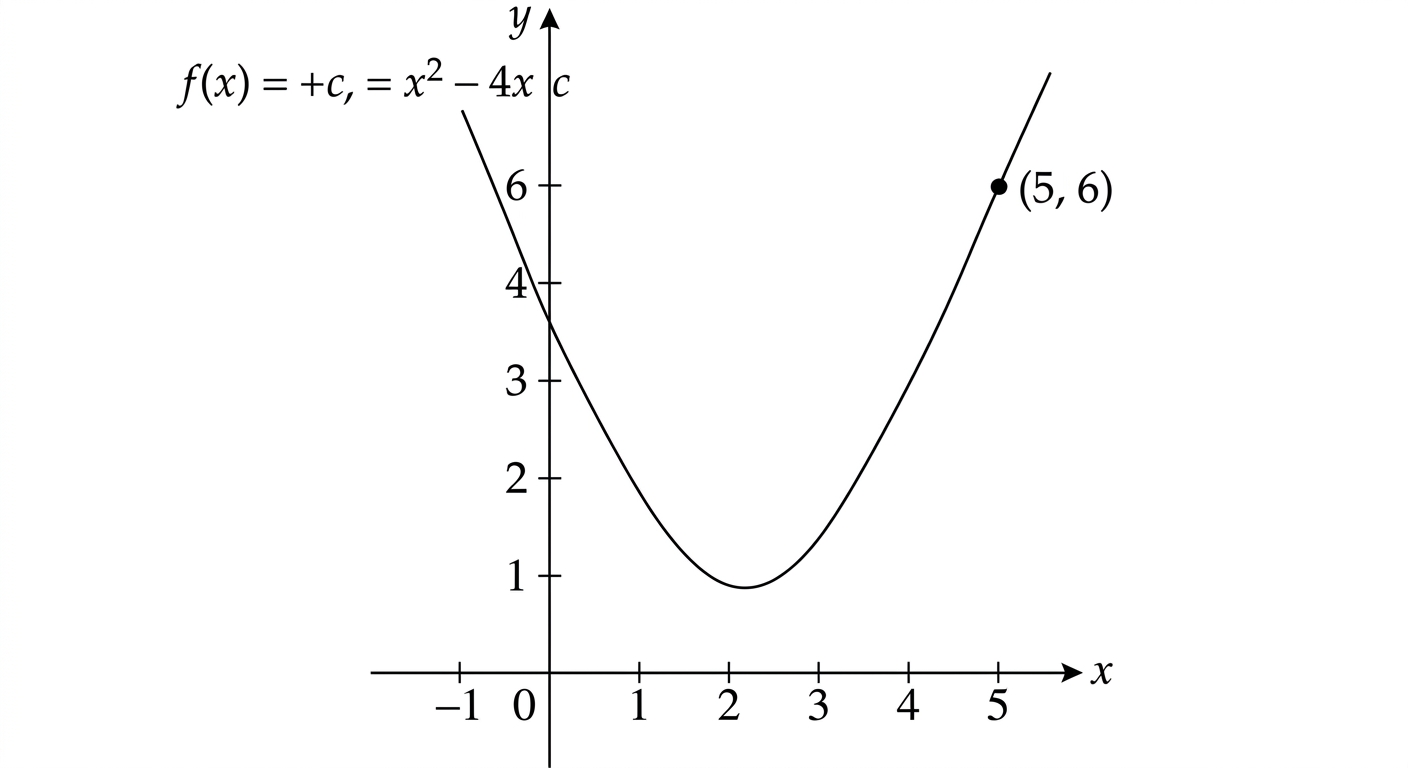
The diagram shows the graph of for , where is a constant.
a
Given that the graph passes through the point , find the value of . [1]
b
Hence write down the coordinates of the -intercept and find the coordinates of the vertex of . [3]
c
State the values of for which has exactly one solution in the domain , justifying your answer. [2]

Solutions
2QuestionAdding and Subtracting Column VectorsAssessment Practice
6 marks~9 minCriterion B
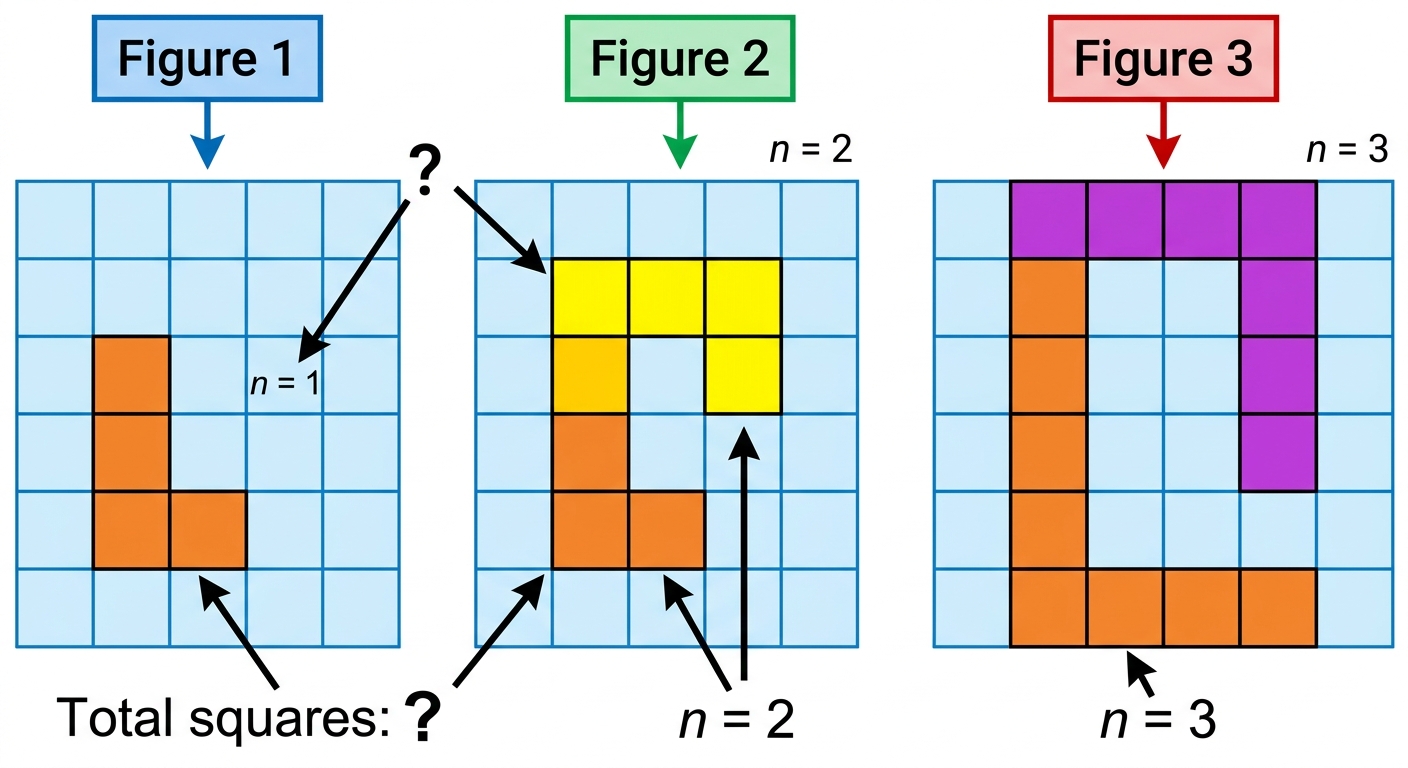
A pattern of growing L-shapes is made from unit squares. The first three figures are shown in the diagram.
a
Write down the number of unit squares in Figure 4. [1]
b
Find a rule for the total number of unit squares in Figure . Give your rule in the form , where , and are integers to be found. [3]
c
A student claims that no figure in this pattern can contain exactly 100 unit squares. Justify whether this claim is correct, using your rule from part (b). [2]
Solutions
3QuestionAdding and Subtracting Vectors GraphicallyAssessment Practice
6 marks~9 minCriterion C
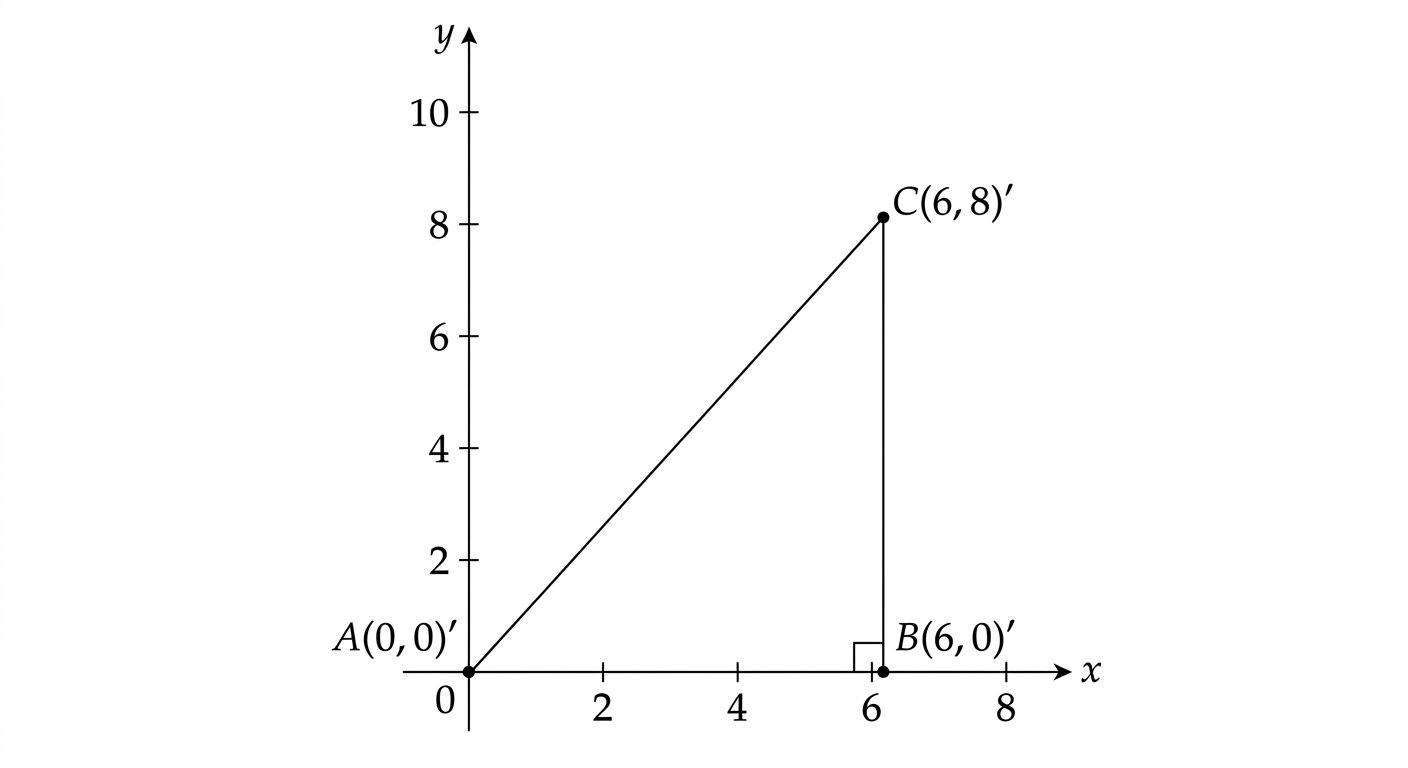
The diagram shows a right triangle drawn on a coordinate grid, where , , and .
a
Write down the length of . [1]
b
Find the length of , giving your answer in exact form. [2]
c
A second triangle is similar to triangle , with corresponding to . Given that , the area of triangle is calculated to be square units. Justify whether this area is correct. [3]
Solutions
4QuestionAdding and Subtracting Column VectorsAssessment Practice
8 marks~12 minCriterion D
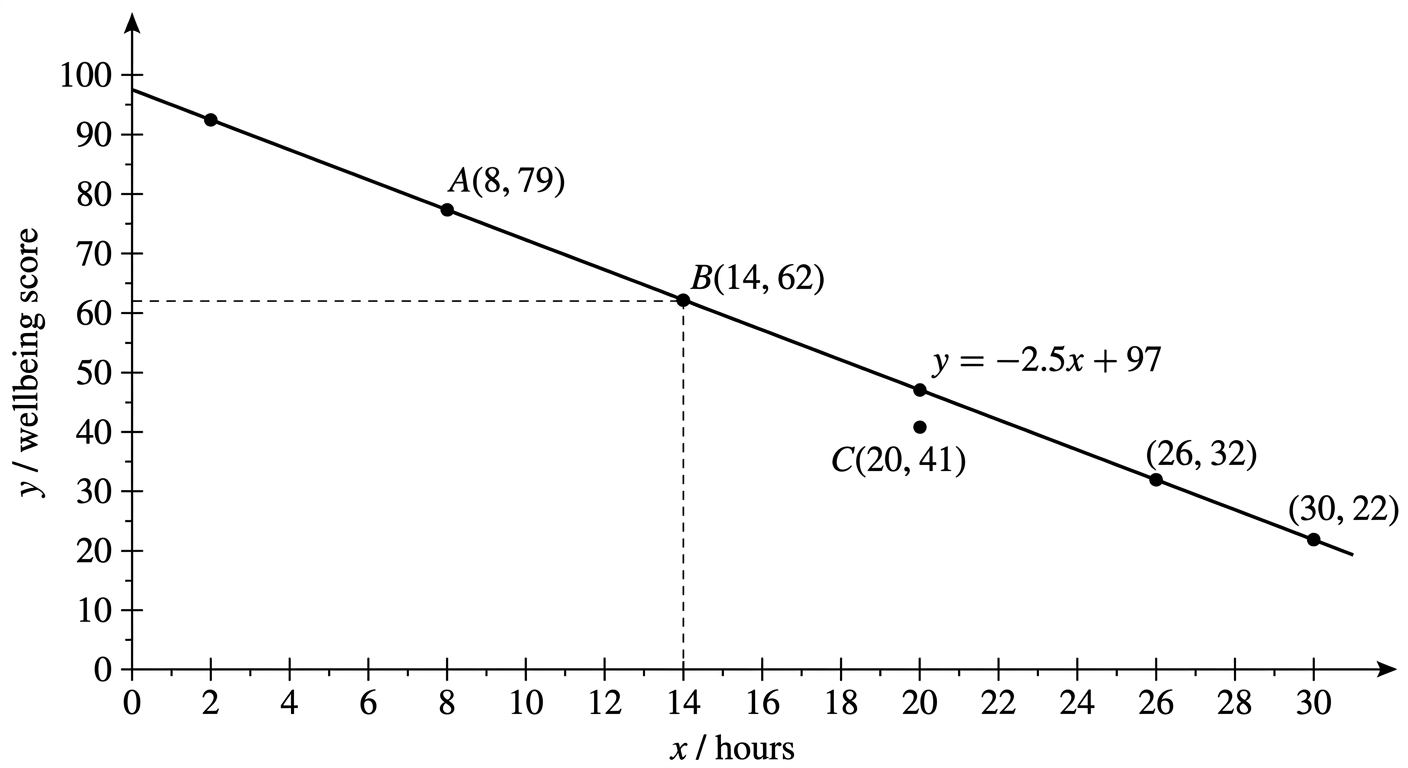
A set of 30 students each recorded the number of hours, , they spent on social media in one week and their score, , on a wellbeing survey (scored out of 100). The mean number of hours is and the mean wellbeing score is .
A student suggests modelling the relationship with the linear equation
where is a constant.
A student suggests modelling the relationship with the linear equation
where is a constant.
a
Show that , given that the line of best fit passes through . [2]
The table below gives data for three students and the scores predicted by the model .
Student A: hours , actual score , predicted score
Student B: hours , actual score , predicted score
Student C: hours , actual score , predicted score
The table below gives data for three students and the scores predicted by the model .
Student A: hours , actual score , predicted score
Student B: hours , actual score , predicted score
Student C: hours , actual score , predicted score
b
Calculate the percentage error for Student A and for Student C, using the formula
Give each answer correct to 2 decimal places. [3]
Give each answer correct to 2 decimal places. [3]
c
A fourth student, Student D, spent 28 hours on social media. Using the model, determine the predicted wellbeing score for Student D. Advise whether this prediction should be trusted, referring to both the percentage errors found in part (b) and the position of relative to the data. [3]
Solutions
That's every free question here — 4 of 140.
+136 more questions, plus Mock Papers & Worksheets, are waiting in Premium.