You're viewing free preview questions — 4 questions previewing here — subscribe to unlock 70 more, plus the Full Question Bank, Mock Papers & Worksheets.Upgrade
Domain and Range — Free MYP5 Mathematics (Standard) Practice Questions

1QuestionRange from graphsAssessment Practice
3 marks~5 minCriterion D
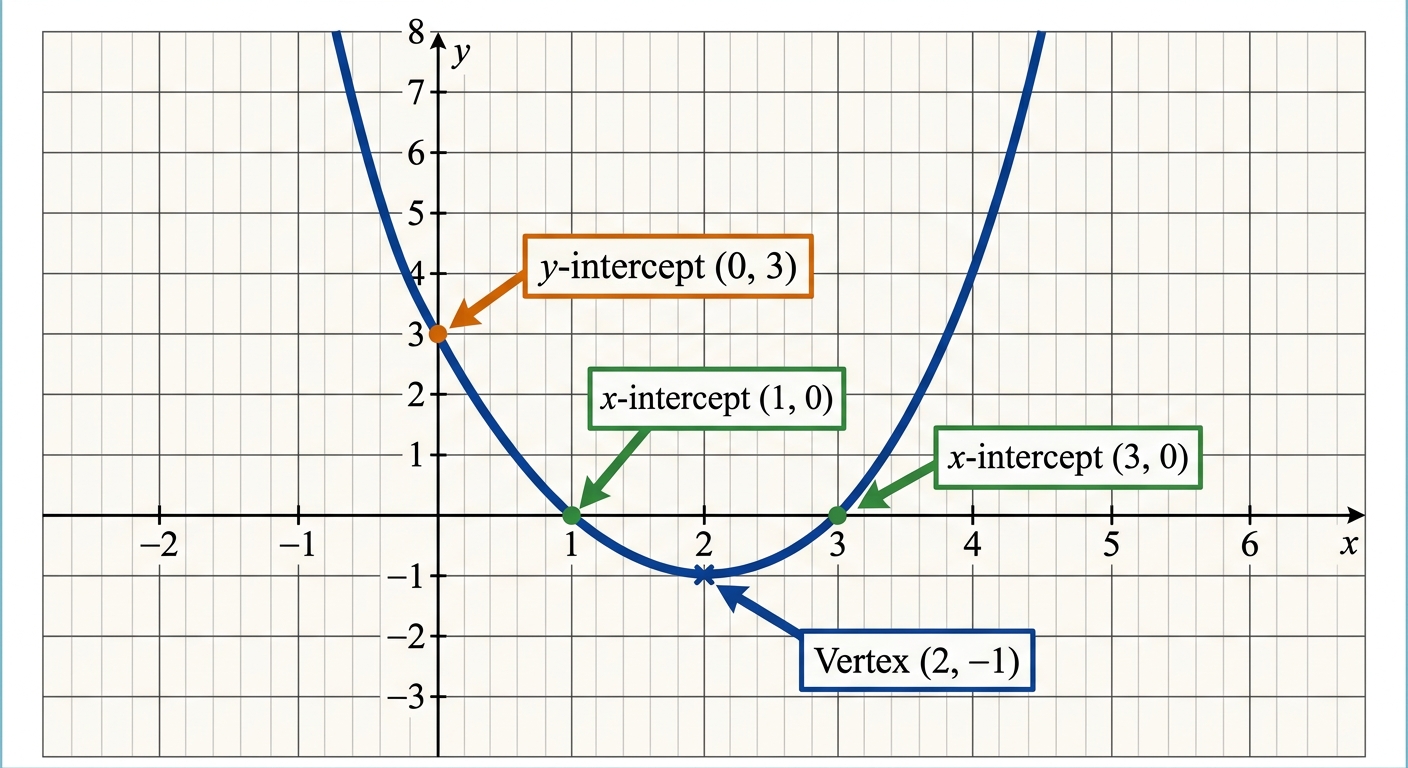
A drone delivery company models the height of a package above ground during a short flight using the function , where is the height in metres and is the time in seconds. The graph of shows a parabola with vertex that opens upwards.
a
Deduce the range of . [1]
b
The package must remain at or above ground level () throughout the flight. Justify whether this model is physically valid, using your answer to part (a). [2]

Solutions
2QuestionRange from graphsAssessment Practice
4 marks~6 minCriterion A
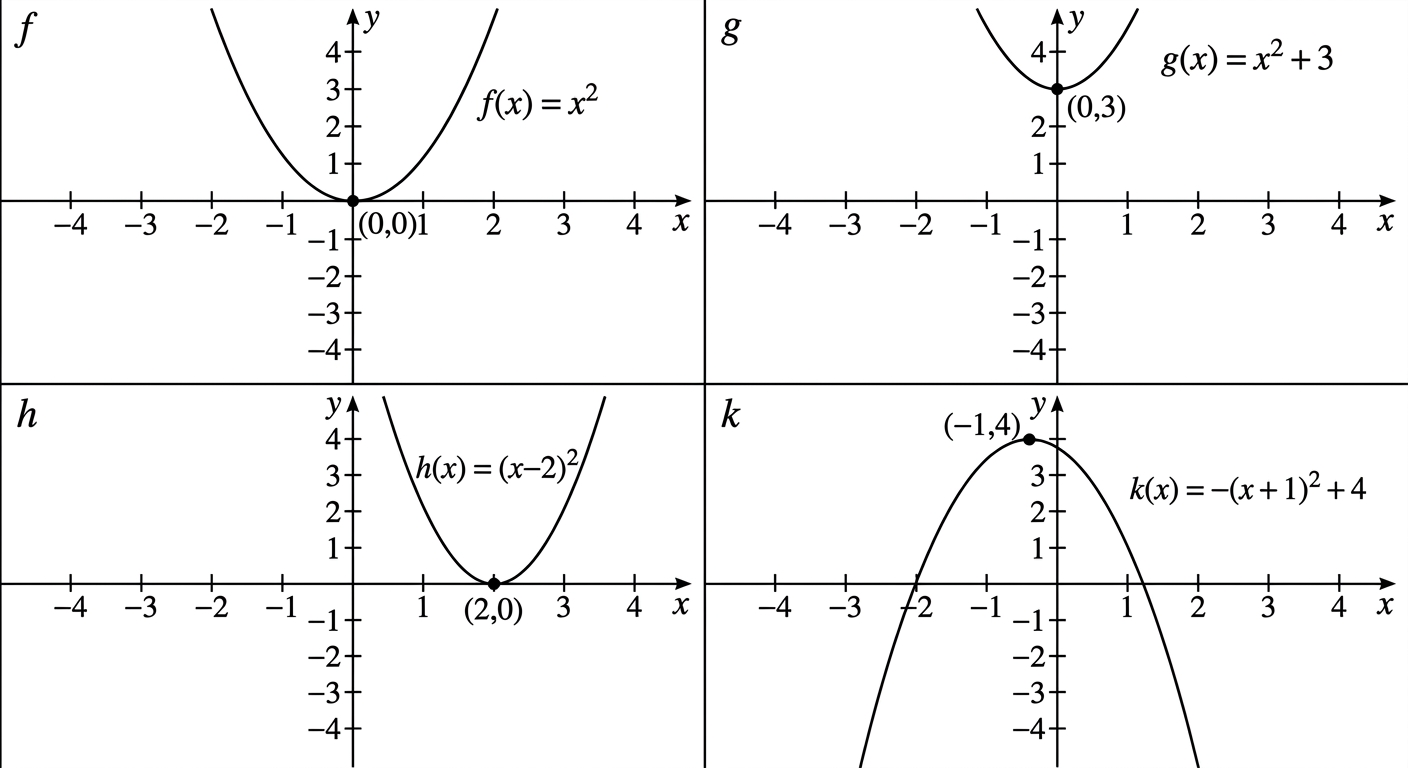
A structural engineer models the vertical clearance beneath four cable-stay bridge sections using quadratic functions. Each function gives height (metres) at horizontal position (metres), with the vertex representing the lowest or highest point of the cable profile.
The four cable profiles are:
, vertex , opens upward
, vertex , opens upward
, vertex , opens upward
, vertex , opens downward
The four cable profiles are:
, vertex , opens upward
, vertex , opens upward
, vertex , opens upward
, vertex , opens downward
a
State the range of each function. [1]
b
Analyse the relationship between the vertex -coordinate, the direction of opening, and the range of each profile. Deduce a general rule connecting the sign of and the vertex -coordinate to the range of . [2]
c
A new bridge section requires a cable profile whose height never exceeds m relative to the reference datum, so the range must be . Construct a valid function satisfying this condition, and justify whether a cable profile with range is physically safe for vehicles passing beneath the bridge. [1]
Solutions
3QuestionRange from graphsAssessment Practice
5 marks~8 minCriterion C
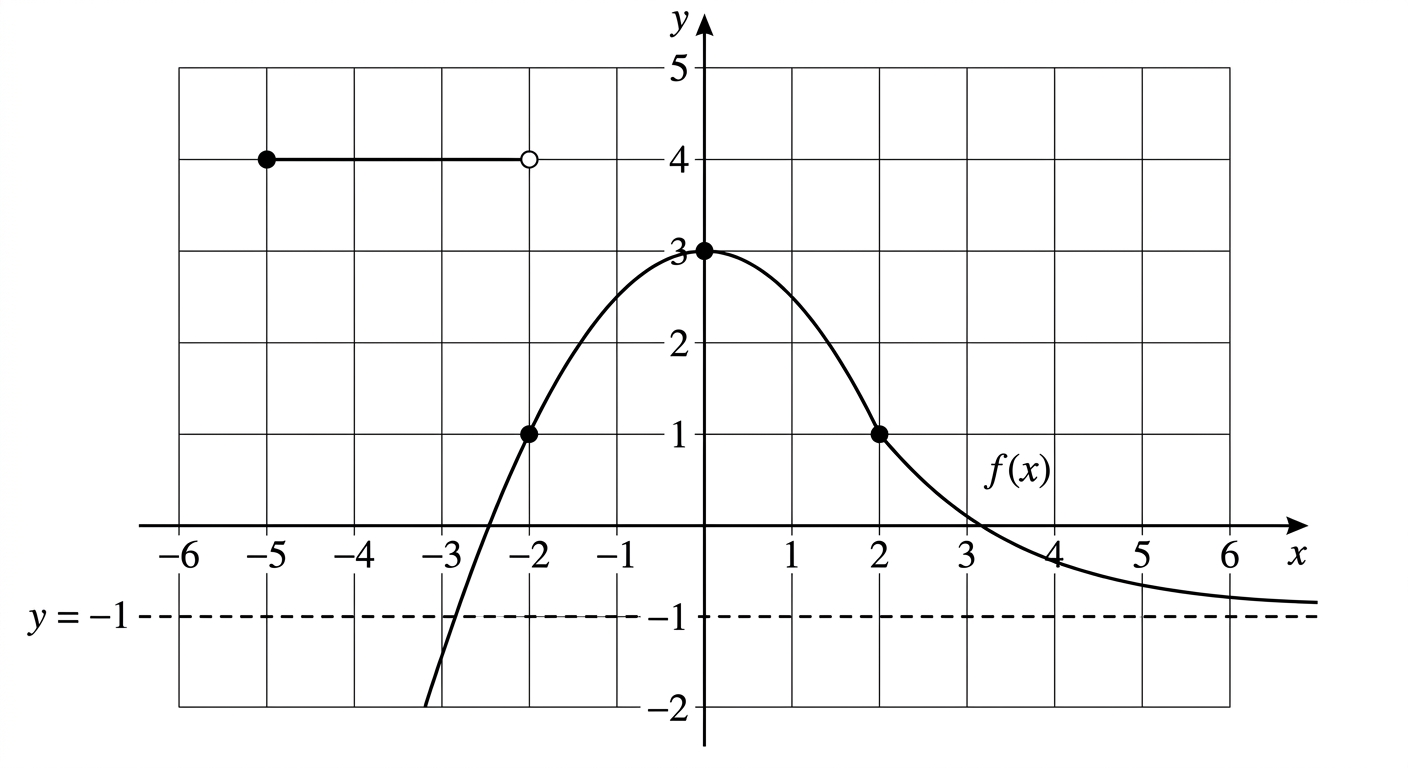
A hospital monitoring system records a patient's oxygen saturation level, (%), over a 24-hour period. The piecewise function is represented by the graph below.
The graph consists of three parts:
- a horizontal segment at for , with a closed circle at and an open circle at
- a downward-opening parabola with vertex , passing through and , with closed circles at both endpoints
- a curve for starting at with a closed circle, decreasing toward the asymptote as , never reaching
The graph consists of three parts:
- a horizontal segment at for , with a closed circle at and an open circle at
- a downward-opening parabola with vertex , passing through and , with closed circles at both endpoints
- a curve for starting at with a closed circle, decreasing toward the asymptote as , never reaching
a
State the -value produced by the horizontal segment and identify whether it is included in the range. [1]
b
Deduce the set of -values contributed by the parabola and by the asymptotic curve, showing your reasoning for each endpoint. [2]
c
Interpret the complete range of in interval notation, and justify whether the gap in the range gives cause for clinical concern about the reliability of the monitoring data. [2]
Solutions
4QuestionRange from graphsAssessment Practice
6 marks~9 minCriterion B
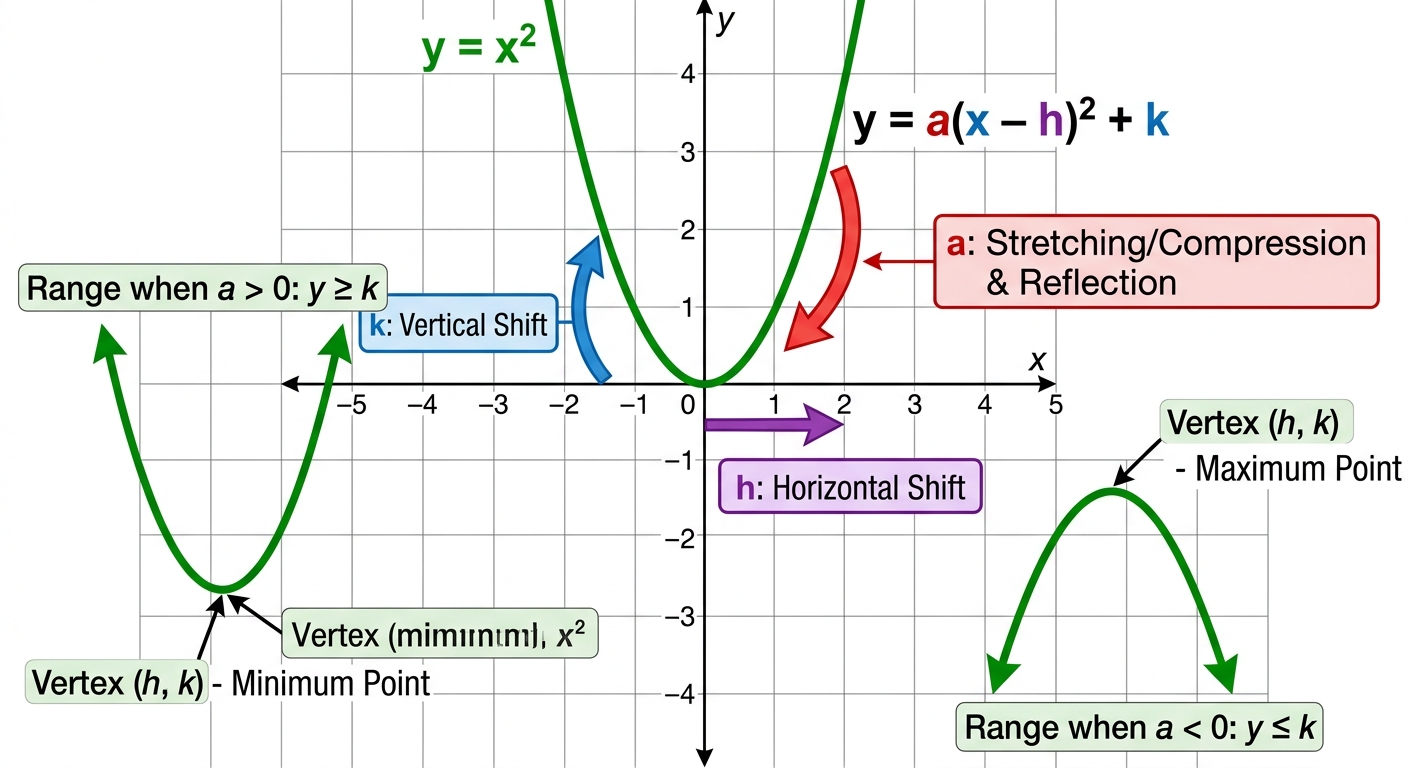
A sports analyst models the height (in metres) of a ball above the ground during a throw using functions of the form , where is horizontal distance (in metres).
Five functions are proposed:
Five functions are proposed:
a
Determine the range of each function. [3]
b
Analyse the five ranges to identify a pattern. State a general rule for the range of in terms of and , and explain why does not affect the range. [2]
c
The analyst claims any function with and cannot model a ball thrown above the ground. Assess whether this claim is correct. [1]
Solutions
That's every free question here — 4 of 74.
+70 more questions, plus Mock Papers & Worksheets, are waiting in Premium.