You're viewing free preview questions — 4 questions previewing here — subscribe to unlock 159 more, plus the Full Question Bank, Mock Papers & Worksheets.Upgrade
Linear Functions — Free MYP5 Mathematics (Standard) Practice Questions

1QuestionPoint-slope formConcept Practice
4 marks~6 minCriterion A
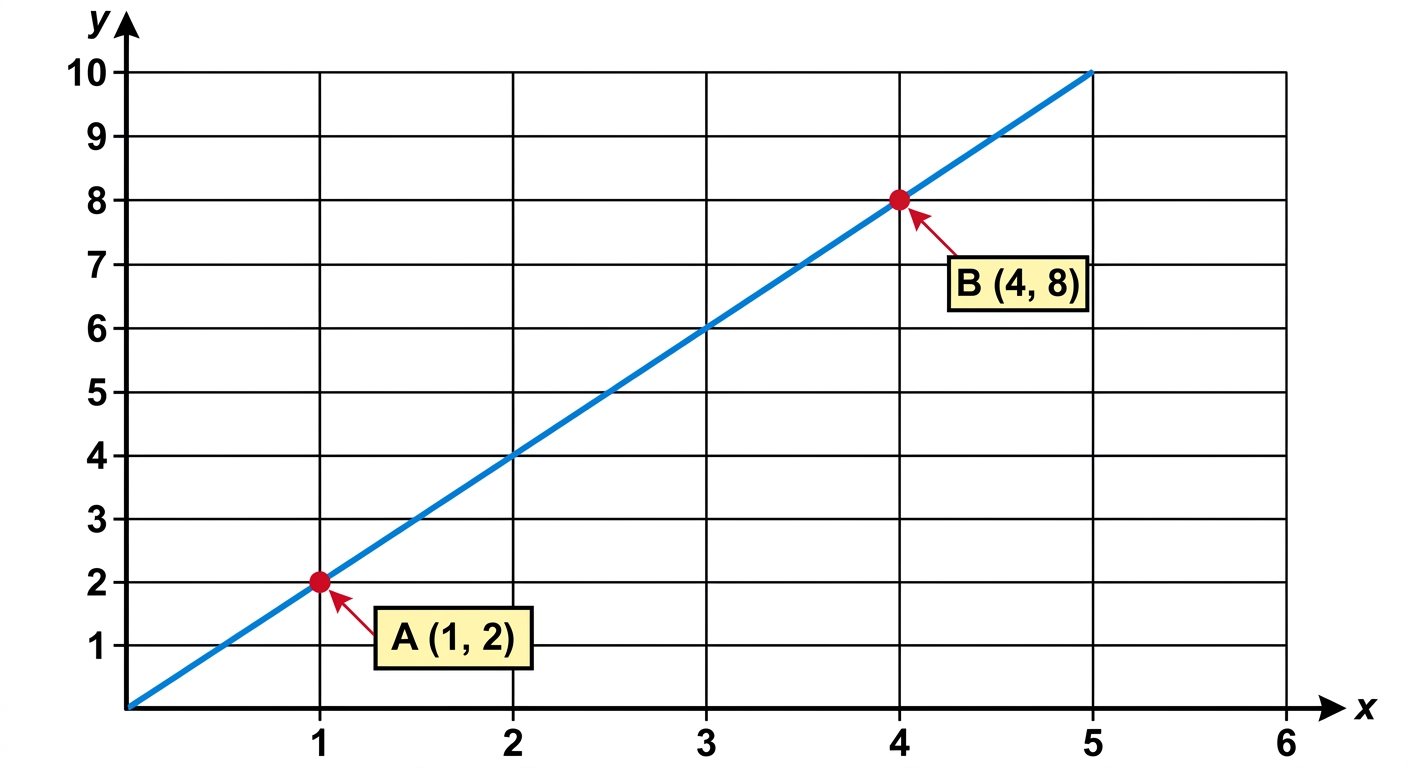
A delivery company charges a fixed connection fee plus a constant rate per kilometre. A driver records that a 1 km trip costs 2 dollars and a 4 km trip costs 8 dollars.
a
Calculate the rate of change (cost per kilometre) using the two data points. [1]
b
Deduce the equation of the cost function in the form , where is distance in kilometres and is total cost in dollars. [2]
c
The company advertises "no connection fee." Justify whether this claim is accurate. [1]

Solutions
2QuestionParallel & perpendicularAssessment Practice
2 marks~3 minCriterion C
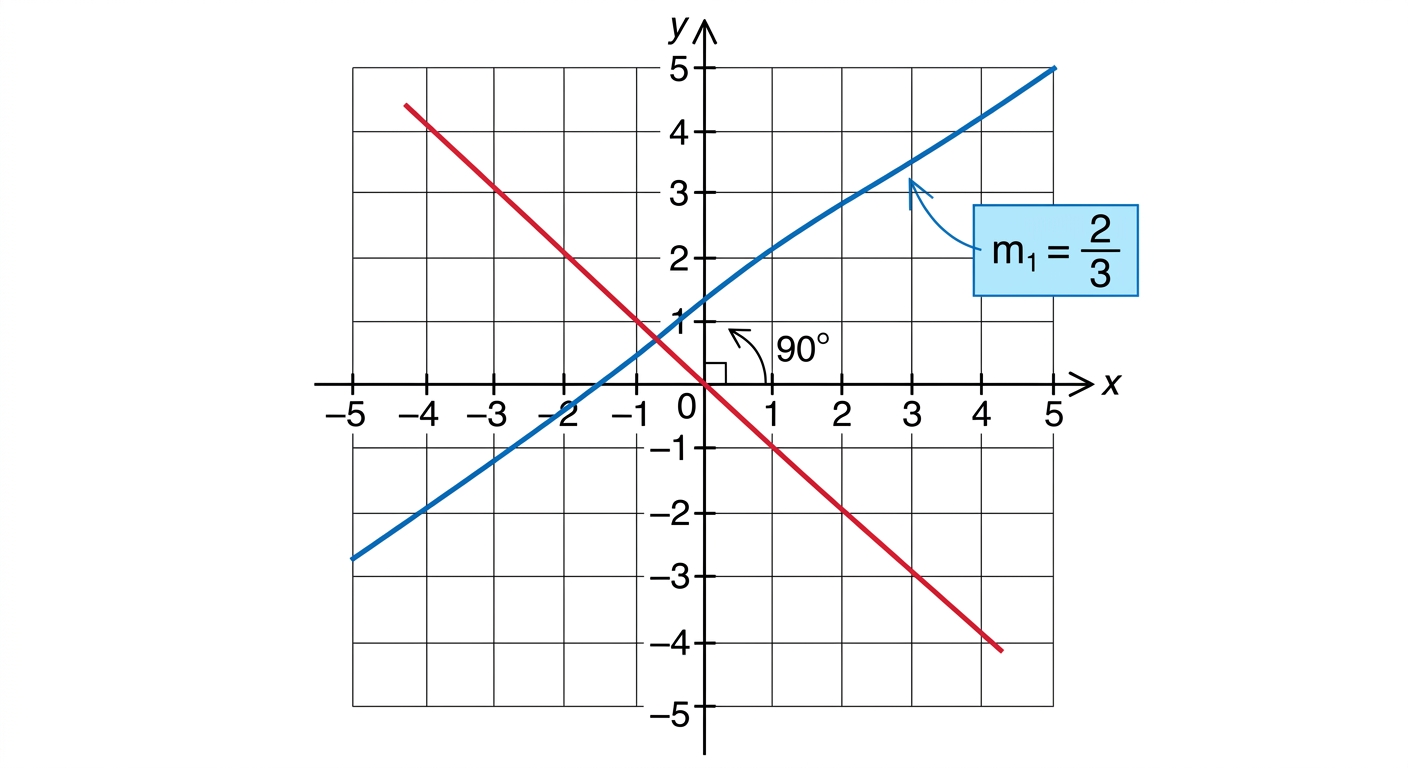
A city planner is designing two straight pedestrian pathways that must cross at a right angle to ensure safe sightlines at the intersection.
The first pathway has a slope of .
The first pathway has a slope of .
a
Deduce the slope of the second pathway. [1]
b
The planner states: "A steeper crossing angle improves pedestrian safety." Justify whether the slopes of the two pathways satisfy the planner's safety condition. [1]
Solutions
3QuestionSlopeAssessment Practice
4 marks~6 minCriterion B
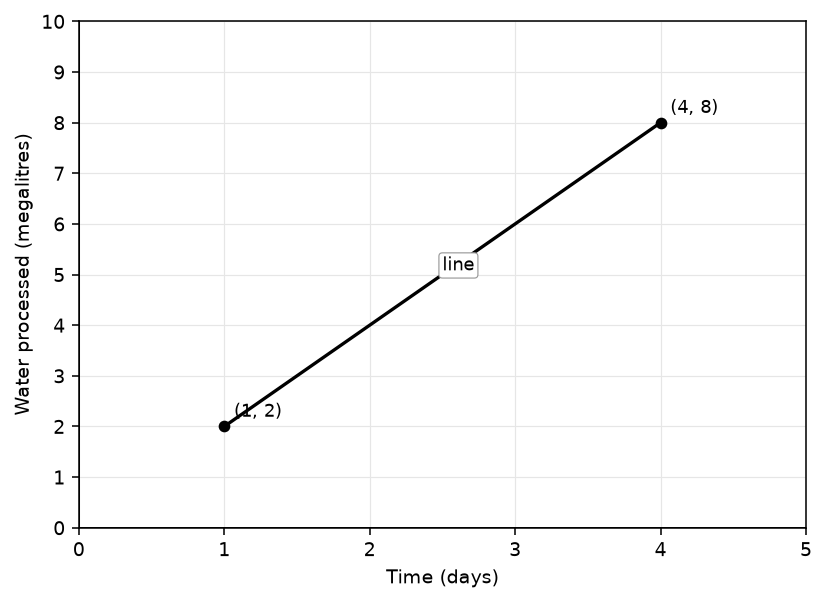
A city's water authority monitors daily water usage at a treatment plant. The graph shows total water processed (in megalitres) against time (in days), modelled as a straight line passing through the labelled points and .
a
Calculate the slope of the line using the two labelled points. [1]
b
Show that the slope is constant by calculating the rise and run between a different pair of points on the line. [2]
c
The authority states: "Usage is increasing at a steady rate, so we can reliably forecast demand using this model." Assess whether the mathematical properties of the graph support this statement. [1]
Solutions
4QuestionGraphing linesAssessment Practice
4 marks~6 minCriterion D
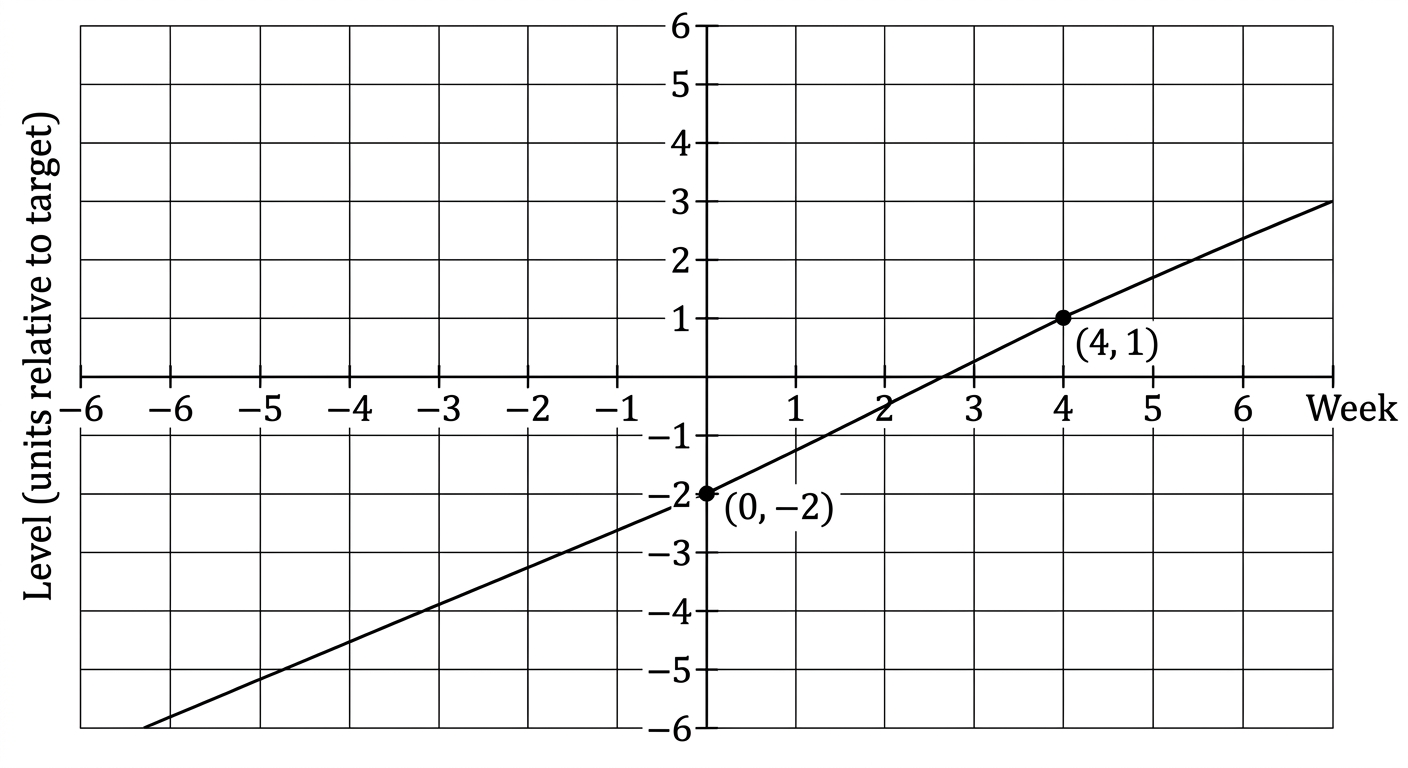
A city's water authority monitors reservoir levels during a drought. Sensors show the water volume is decreasing at a constant rate. At the start of monitoring (week 0), the reservoir holds units relative to the target level, and by week 4 it holds unit relative to the target level, where each unit represents 10 million litres.
a
Calculate the slope of the line passing through and . [1]
b
Deduce the equation of the line in the form . [1]
c
Interpret what the slope and -intercept reveal about the reservoir's situation, and advise the authority whether action is still required to safeguard the water supply. [2]
Solutions
That's every free question here — 4 of 163.
+159 more questions, plus Mock Papers & Worksheets, are waiting in Premium.