You're viewing free preview questions — 4 questions previewing here — subscribe to unlock 34 more, plus the Full Question Bank, Mock Papers & Worksheets.Upgrade
Interpreting Real-Life Graphs — Free MYP5 Mathematics (Standard) Practice Questions

1QuestionConnecting Graphs to Real SituationsConcept Practice
2 marks~3 minCriterion A
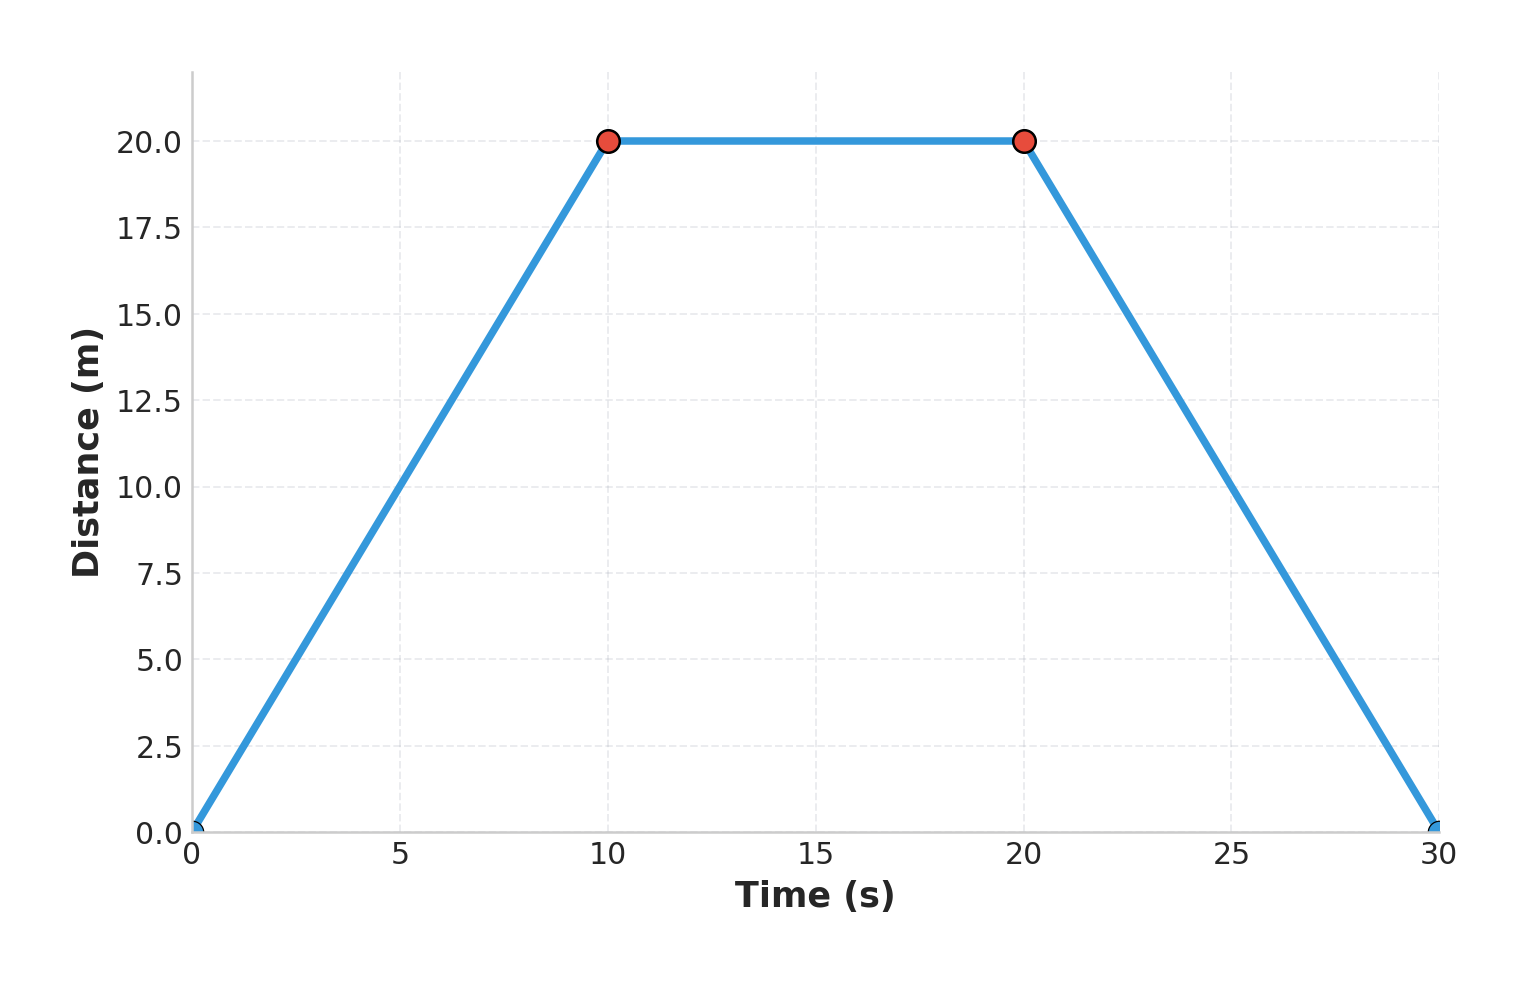
A cyclist's journey is shown on the distance–time graph.
Segment A: to s, distance increases from m to m.
Segment B: s to s, distance remains constant at m.
Segment C: s to s, distance decreases from m to m.
Segment A: to s, distance increases from m to m.
Segment B: s to s, distance remains constant at m.
Segment C: s to s, distance decreases from m to m.
a
Calculate the gradient of Segment A. [1]
b
Interpret what the gradient of Segment B tells you about the cyclist's motion during that interval. [1]

Solutions
2QuestionConnecting Graphs to Real SituationsAssessment Practice
4 marks~6 minCriterion C
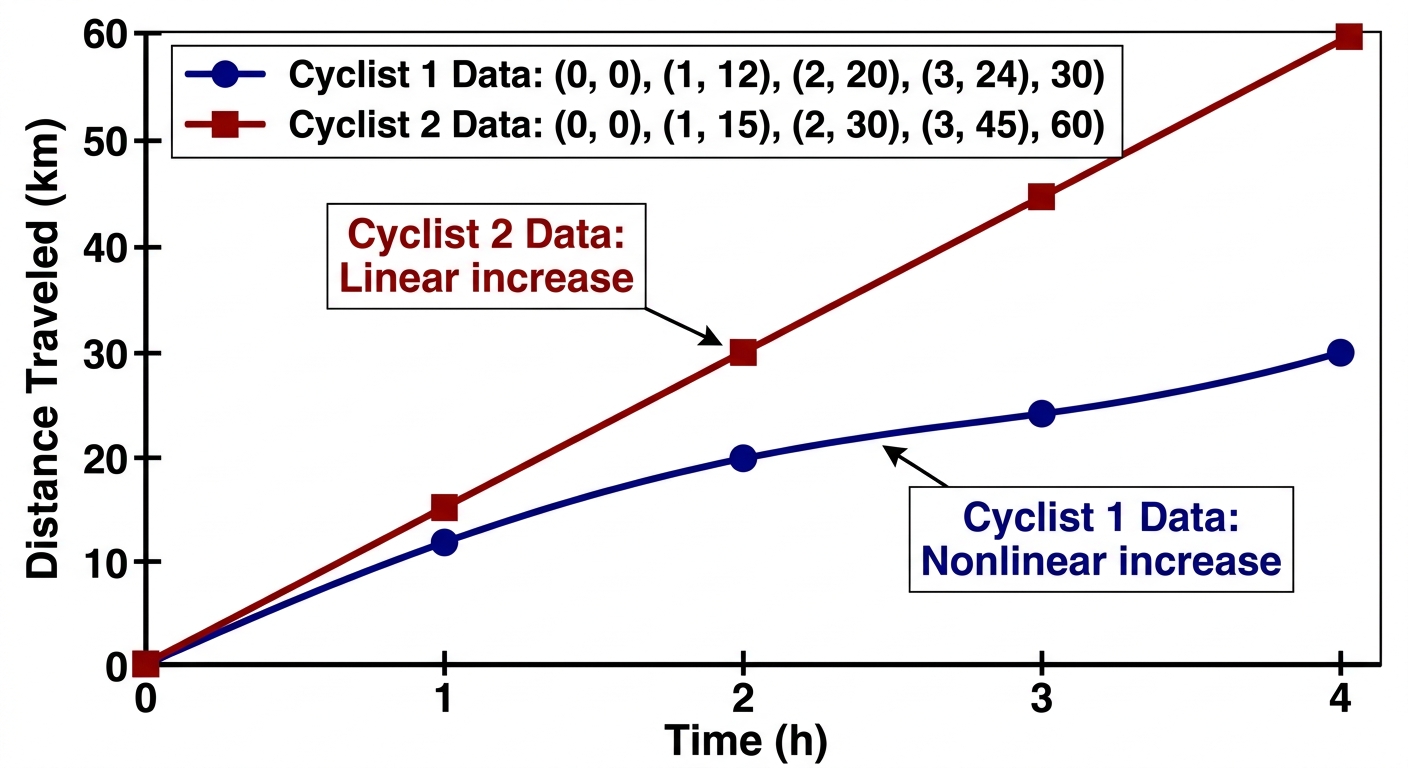
A cyclist rides a hilly route. Her distance from the start is recorded every hour:
Time (h):
Distance (km):
A second cyclist rides a flat road at constant speed:
Time (h):
Distance (km):
Time (h):
Distance (km):
A second cyclist rides a flat road at constant speed:
Time (h):
Distance (km):
a
Construct a distance–time graph showing both cyclists on the same axes. [1]
b
Explain why one graph is a straight line and the other is a curve, referring to each cyclist's speed. [2]
c
The hilly-route cyclist claims she maintained an "acceptable average speed" of at least km/h throughout every individual hour of her journey. Justify whether this claim is valid. [1]
Solutions
3QuestionReading Distance-Time GraphsConcept Practice
3 marks~5 minCriterion C
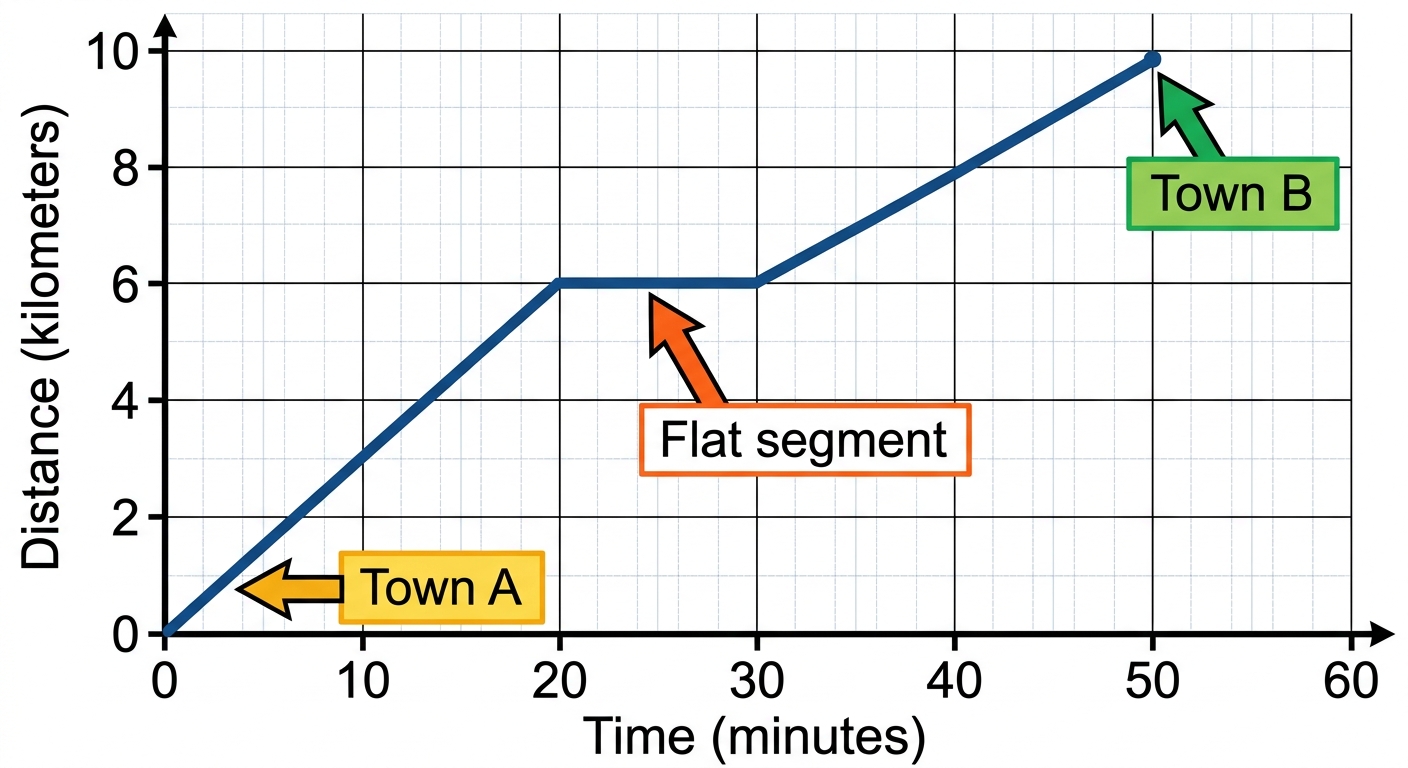
A cyclist travels from town A to town B. The distance–time graph for the journey contains a horizontal segment.
a
Explain what the horizontal segment indicates about the cyclist's motion. [1]
b
Discuss one limitation of using a distance–time graph to represent this journey. In your response, refer to specific information that the graph does not show. [2]
Solutions
4QuestionConnecting Graphs to Real SituationsAssessment Practice
4 marks~6 minCriterion D
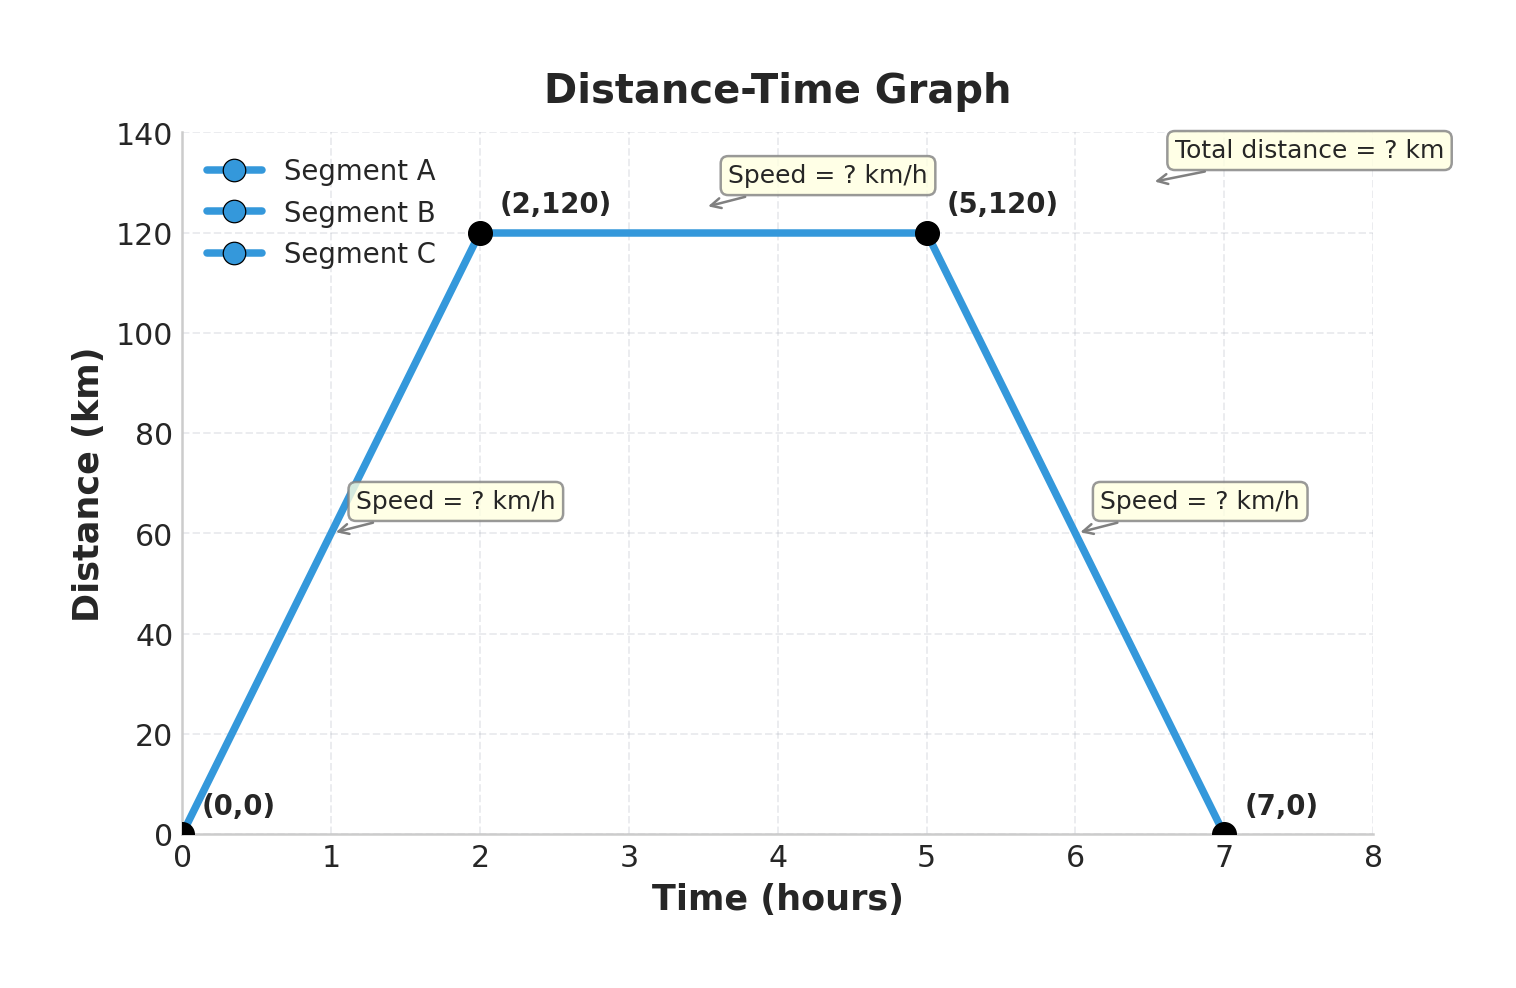
A car journey is shown on the distance–time graph.
- Segment A: to
- Segment B: to
- Segment C: to
Time is in hours; distance is in kilometres.
- Segment A: to
- Segment B: to
- Segment C: to
Time is in hours; distance is in kilometres.
a
Calculate the speed of the car during Segment A. [1]
b
Calculate the total distance travelled during the entire journey. [1]
c
The legal speed limit on this road is 55 km/h. Advise the driver whether they broke the speed limit at any point during the journey, justifying your answer with the speeds from all three segments. [2]
Solutions
That's every free question here — 4 of 38.
+34 more questions, plus Mock Papers & Worksheets, are waiting in Premium.