You're viewing free preview questions — 4 questions previewing here — subscribe to unlock 84 more, plus the Full Question Bank, Mock Papers & Worksheets.Upgrade
Collecting and Organizing Data — Free MYP5 Mathematics (Standard) Practice Questions

1QuestionDesigning Surveys and QuestionnairesConcept Practice
2 marks~3 minCriterion A
A school has students listed on its register.
Describe a method a student could use to select a simple random sample of 100 students from this register. [2]
Describe a method a student could use to select a simple random sample of 100 students from this register. [2]
Solutions

2QuestionMethods of Data Collection and SamplingAssessment Practice
2 marks~3 minCriterion D
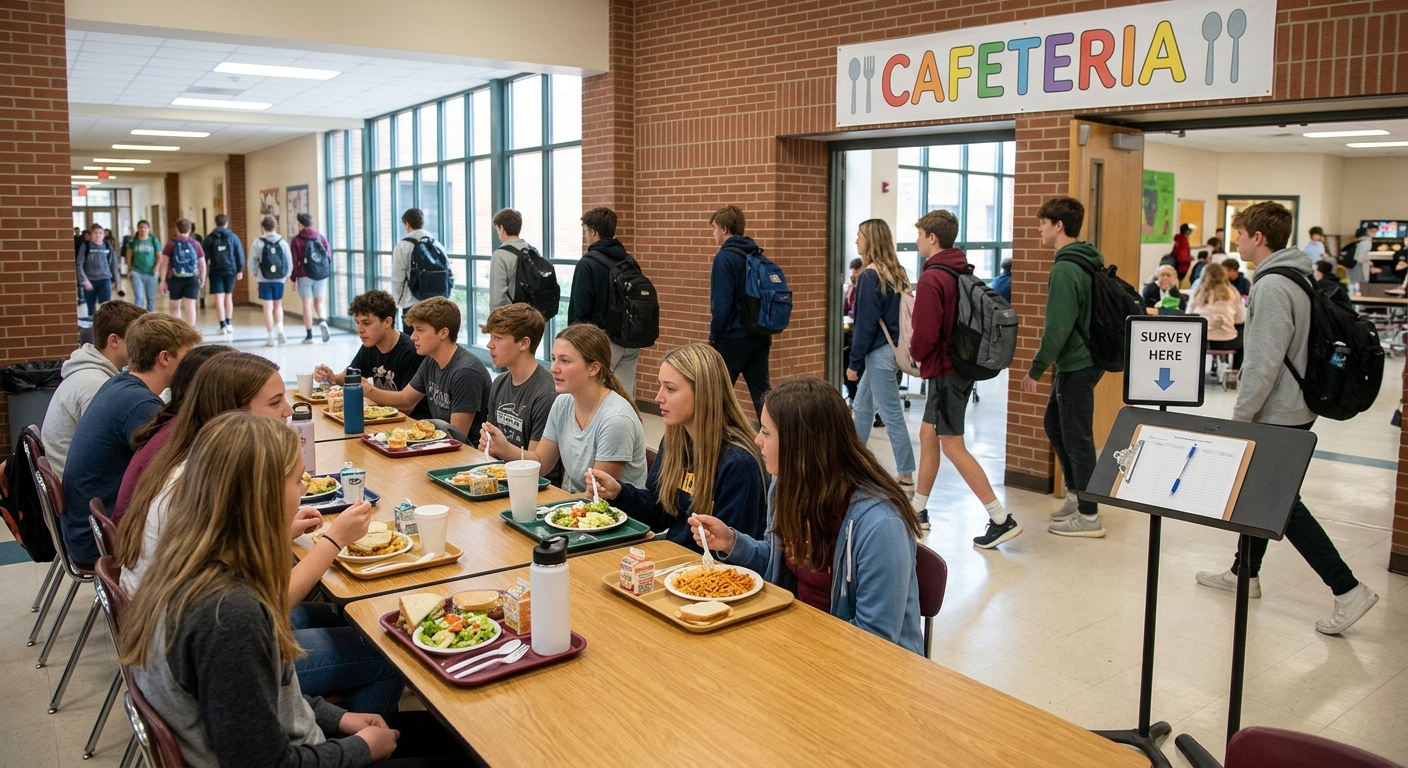
A school wants to estimate overall student satisfaction with cafeteria food. The survey team plans to collect responses only from students present in the cafeteria during lunch.
Explain why this sampling method is biased and how it could lead to a misrepresentation of the entire student population's satisfaction levels. [2]
Explain why this sampling method is biased and how it could lead to a misrepresentation of the entire student population's satisfaction levels. [2]
Solutions
3QuestionDesigning Surveys and QuestionnairesAssessment Practice
6 marks~9 minCriterion C
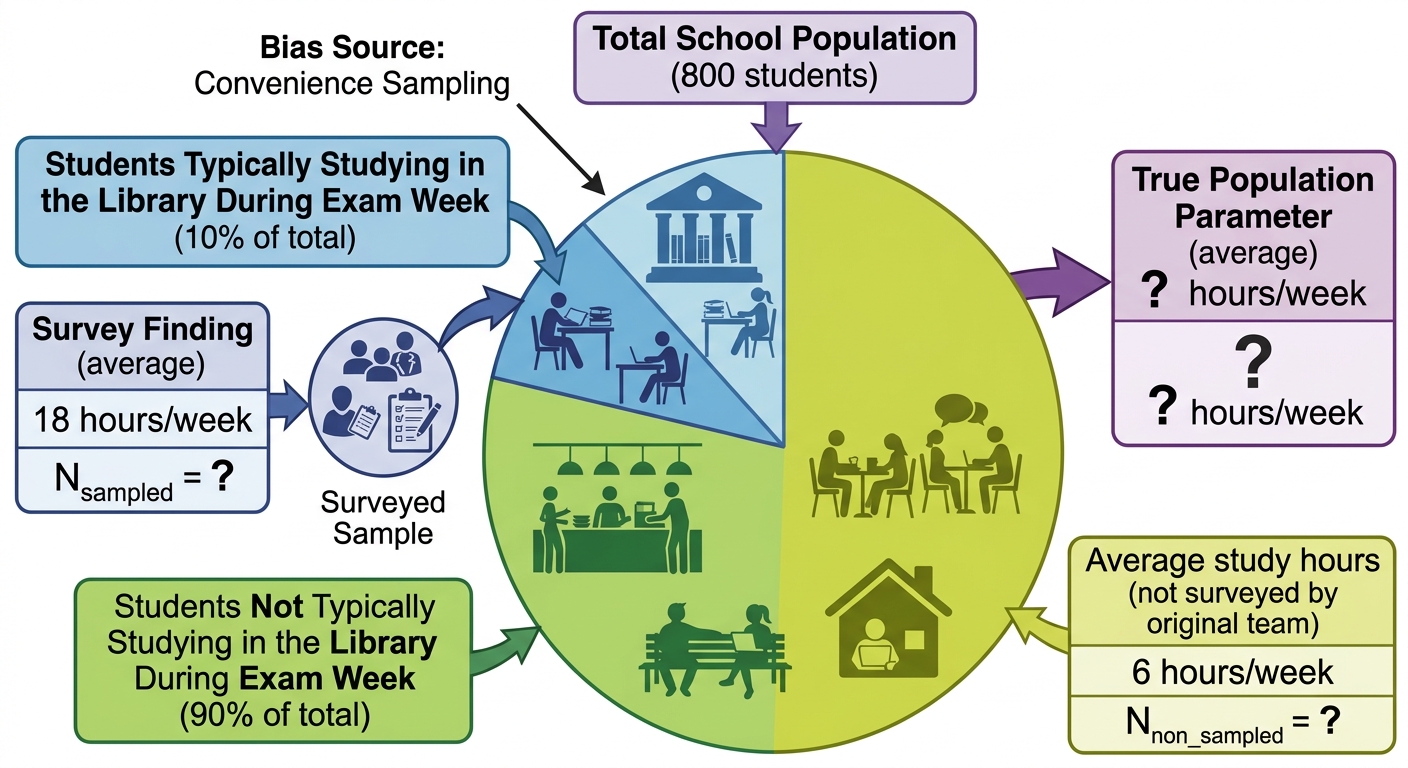
A school wants to estimate the average number of hours students spend studying each week. During exam week, the survey team asks every student present in the library. These 80 students report an average of 18 hours per week. The remaining 720 students, surveyed separately, report an average of 6 hours per week.
a
Identify the type of sampling bias present in this survey design and explain how it causes the library-only result to overestimate the true school-wide average. [2]
b
Calculate the true average weekly study hours for all 800 students. Show your working clearly. [2]
c
The school principal states: "An average of 7.2 hours per week is too low to reflect real student effort — we should use the library figure of 18 hours when reporting to parents."
Advise the principal on whether the figure of 18 hours should be used in the school-wide report, justifying your answer with reference to what the calculated average actually represents. [2]
Advise the principal on whether the figure of 18 hours should be used in the school-wide report, justifying your answer with reference to what the calculated average actually represents. [2]
Solutions
4QuestionDesigning Surveys and QuestionnairesAssessment Practice
6 marks~9 minCriterion B
A school surveys students about their lunch preferences. Responses are recorded across four 2-hour time slots over three consecutive days.
Time slots: 8–10, 10–12, 12–14, 14–16
Time slots: 8–10, 10–12, 12–14, 14–16
| Day 1 | 24 | 48 | 36 | 18 |
|---|---|---|---|---|
| Day 2 | 30 | 60 | 45 | 22 |
| Day 3 | 36 | 72 | 54 | 26 |
a
Analyse the relationship between the 8–10 and 10–12 response counts, and between the 10–12 and 12–14 response counts, for each day. [2]
b
Deduce the predicted number of responses for the 10–12 slot on Day 4. Show your working. [2]
c
The school will only adjust the lunch menu if the 10–12 slot consistently attracts more than 1.5 times the responses of any other single slot across all days. Advise the school whether the lunch menu should be adjusted, justifying your answer using your findings from parts (a) and (b). [2]
Solutions
That's every free question here — 4 of 88.
+84 more questions, plus Mock Papers & Worksheets, are waiting in Premium.