You're viewing free preview questions — 4 questions previewing here — subscribe to unlock 69 more, plus the Full Question Bank, Mock Papers & Worksheets.Upgrade
Measures of Dispersion — Free MYP5 Mathematics (Standard) Practice Questions

1QuestionBox and Whisker Plots for Spread of DataConcept Practice
4 marks~6 minCriterion A
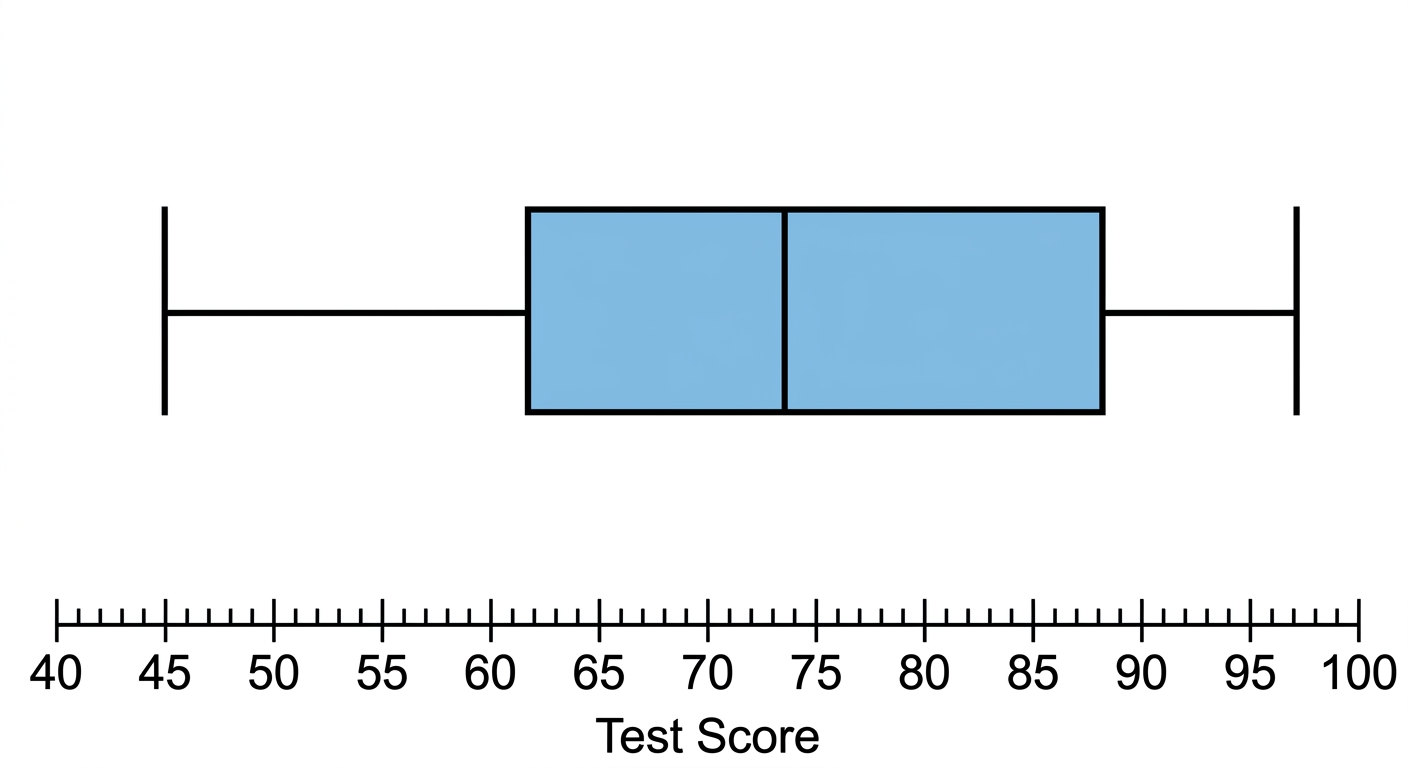
A school's sports coordinator records the sprint times (in seconds) of 30 students during a fitness assessment. The box-and-whisker plot displays the results, with the following five-number summary:
Minimum s, s, Median s, s, Maximum s
Students who score within 4 seconds of the median are classified as "consistent performers."
Minimum s, s, Median s, s, Maximum s
Students who score within 4 seconds of the median are classified as "consistent performers."
a
Calculate the range of the sprint times. [1]
b
Calculate the interquartile range (IQR) of the sprint times. [1]
c
Justify whether the middle 50% of students qualify as consistent performers, using the IQR. [2]

Solutions
2QuestionCalculating the interquartile rangeAssessment Practice
4 marks~6 minCriterion C
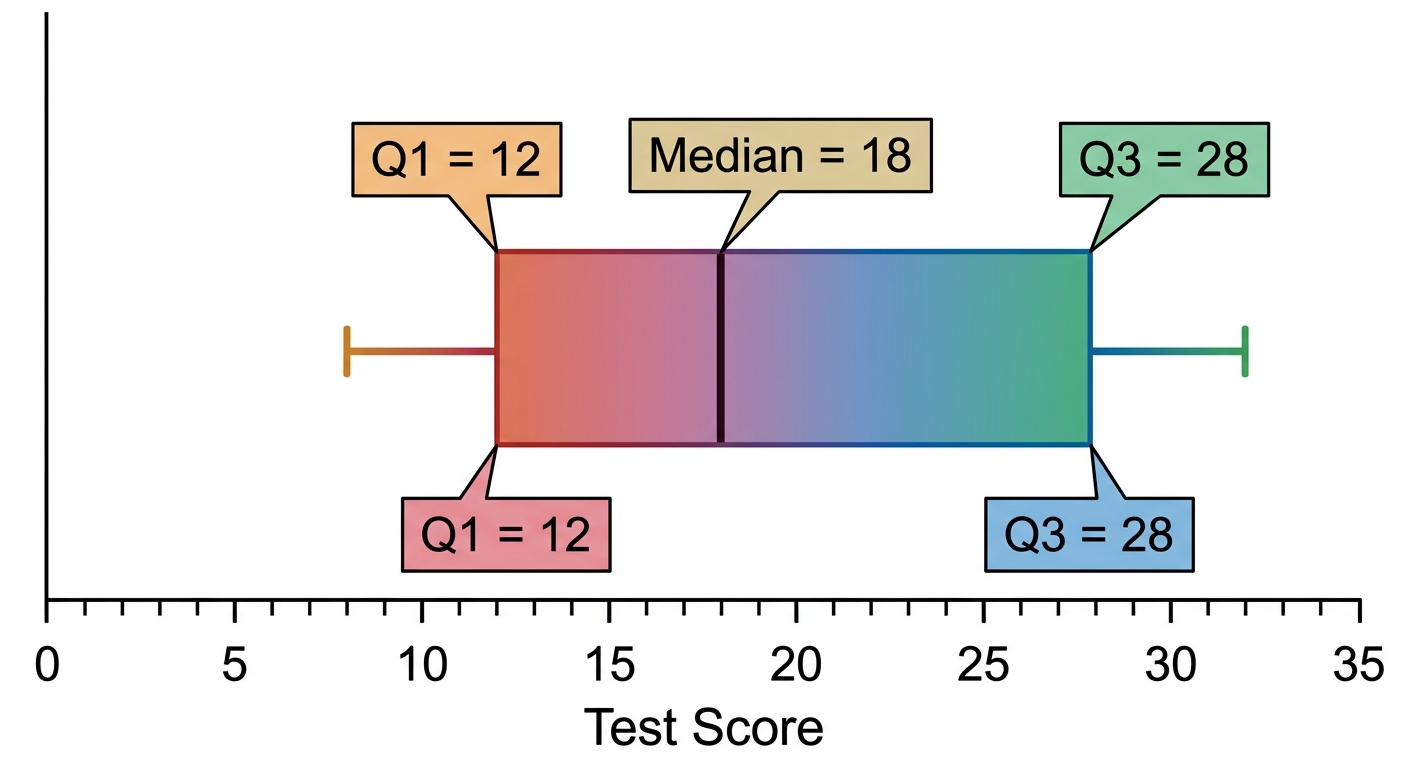
A school tracks student performance on a standardised mathematics assessment. The box plot shows the distribution of scores for a class of 30 students. The minimum score is 4, the maximum is 40, , the median , and .
a
Calculate the interquartile range (IQR). [1]
b
Analyse the symmetry of the distribution by calculating the distance from to the median and from the median to . Hence deduce the direction of skew. [2]
c
The school's intervention policy states that the middle 50% of scores must span no more than 20 marks for the group to be considered "consistent." Justify whether this class meets the consistency criterion, and explain what the skewness suggests about the spread of scores in the lower half of the distribution. [1]
Solutions
3QuestionBox and Whisker Plots for Spread of DataAssessment Practice
6 marks~9 minCriterion D
A school uses exam scores from 120 students to decide whether to adjust its teaching programme. The box-and-whisker plot displays the distribution of scores with the following five-number summary:
Minimum , , Median , , Maximum
Minimum , , Median , , Maximum
a
Calculate the interquartile range (IQR) of the exam scores. [2]
b
Deduce the number of students whose scores fall within the interquartile range and the number whose scores fall within the upper whisker (from to the maximum). [2]
c
The school's policy states that a teaching programme requires adjustment if more than 30% of students score below . Advise the school board whether the teaching programme requires adjustment, justifying your answer with reference to the data. [2]
Solutions
4QuestionRange and Interquartile RangeAssessment Practice
8 marks~12 minCriterion B
A city's air-quality monitoring network records daily fine-particle counts (µg/m³) at five sensors. On days following an industrial emission event, the highest reading rises progressively while the other four remain fixed:
Day 1:
Day 2:
Day 3:
Day 4:
Day 5:
Day 1:
Day 2:
Day 3:
Day 4:
Day 5:
a
Calculate the range and interquartile range (IQR) for each of the five datasets. [2]
b
Deduce the range and IQR for the dataset , justifying your answer using the pattern observed in part (a). [2]
c
Calculate the range and IQR for the dataset and verify whether your deduction in part (b) is correct. [2]
d
The health authority uses the IQR, not the range, to assess whether air-quality readings are "stable" across sensors. Advise the health authority whether this choice is sufficient for reliable stability assessment, using your results to support your recommendation. [2]
Solutions
That's every free question here — 4 of 73.
+69 more questions, plus Mock Papers & Worksheets, are waiting in Premium.