You're viewing free preview questions — 4 questions previewing here — subscribe to unlock 126 more, plus the Full Question Bank, Mock Papers & Worksheets.Upgrade
Probability Rules and Tree Diagrams — Free MYP5 Mathematics (Standard) Practice Questions

1QuestionSolving Problems using tree diagrams and Venn DiagramsConcept Practice
6 marks~9 minCriterion A
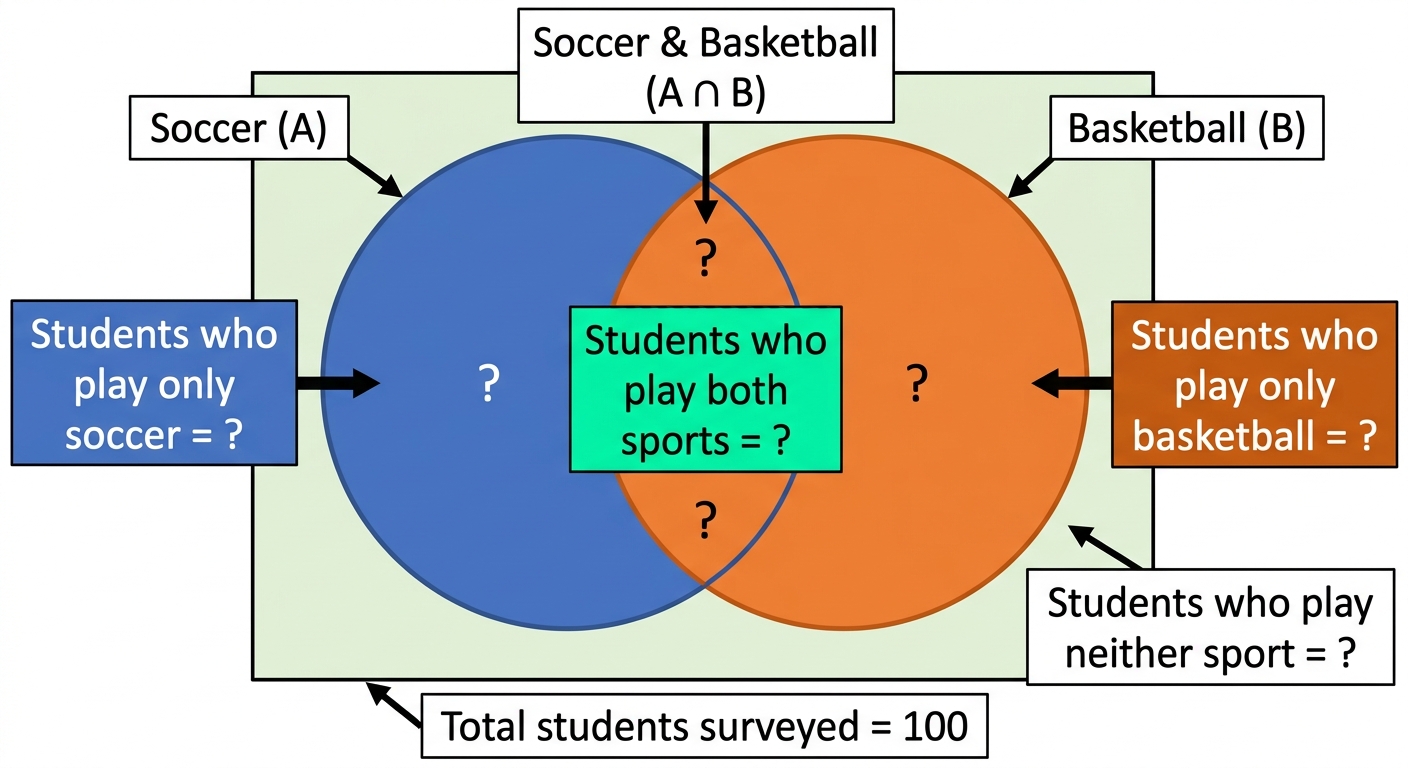
A school survey of 100 students recorded participation in soccer (event ) and basketball (event ). The results are summarised below:
- Students playing only soccer: 30
- Students playing only basketball: 25
- Students playing both sports: 15
- Students playing neither sport: 30
- Students playing only soccer: 30
- Students playing only basketball: 25
- Students playing both sports: 15
- Students playing neither sport: 30
a
State the value of . [1]
b
Calculate and . [2]
c
Using the formula , calculate . [1]
d
The school requires that more than 65% of surveyed students participate in at least one sport to qualify for additional funding. Justify whether this school meets the requirement. [2]

Solutions
2QuestionSolving Problems using tree diagrams and Venn DiagramsAssessment Practice
2 marks~3 minCriterion C
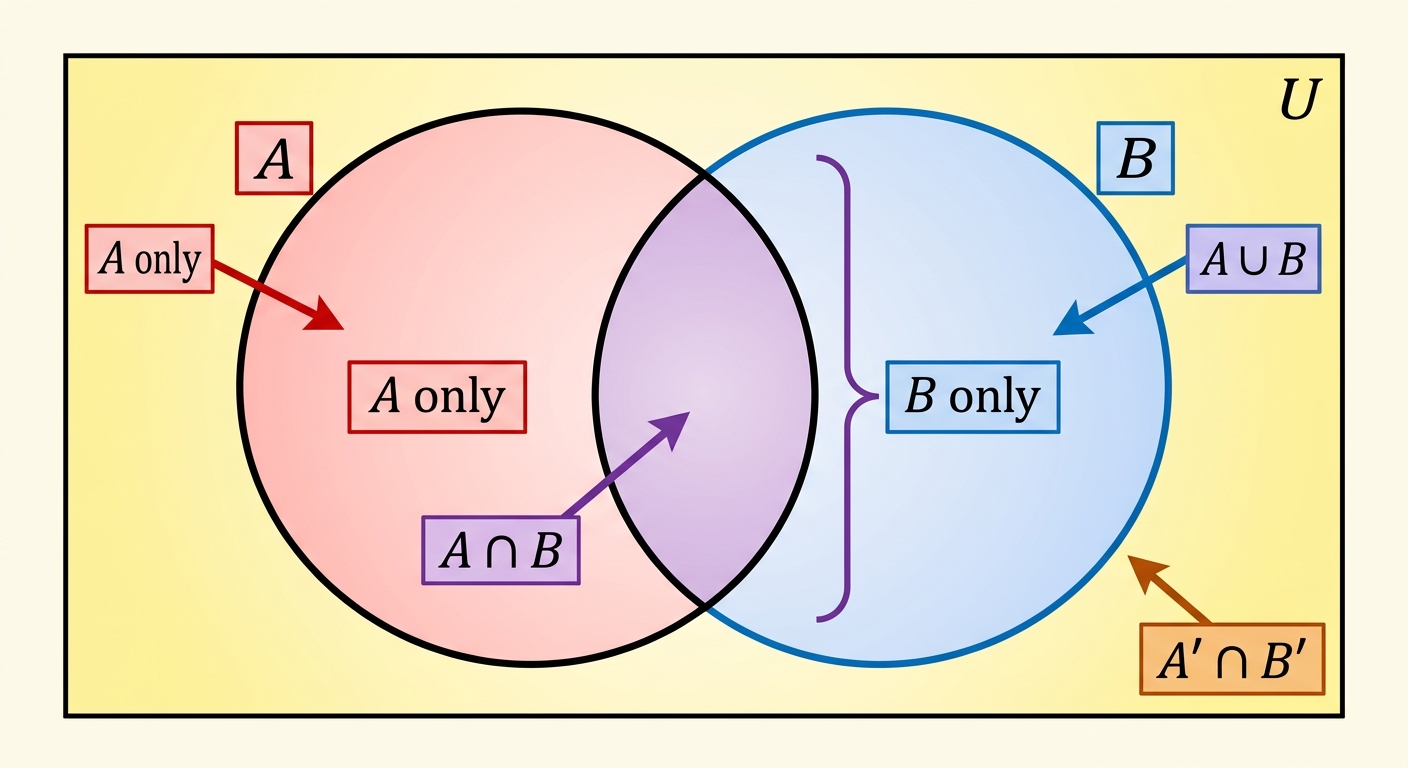
A school class has 33 students. Let be the set of students who play football and the set of students who play basketball, where , , , and .
Using correct set notation, write one complete sentence that describes the relationship between and , referring to the universal set of all students in the class. [2]
Using correct set notation, write one complete sentence that describes the relationship between and , referring to the universal set of all students in the class. [2]
Solutions
3QuestionCalculating Combined ProbabilitiesAssessment Practice
4 marks~6 minCriterion D
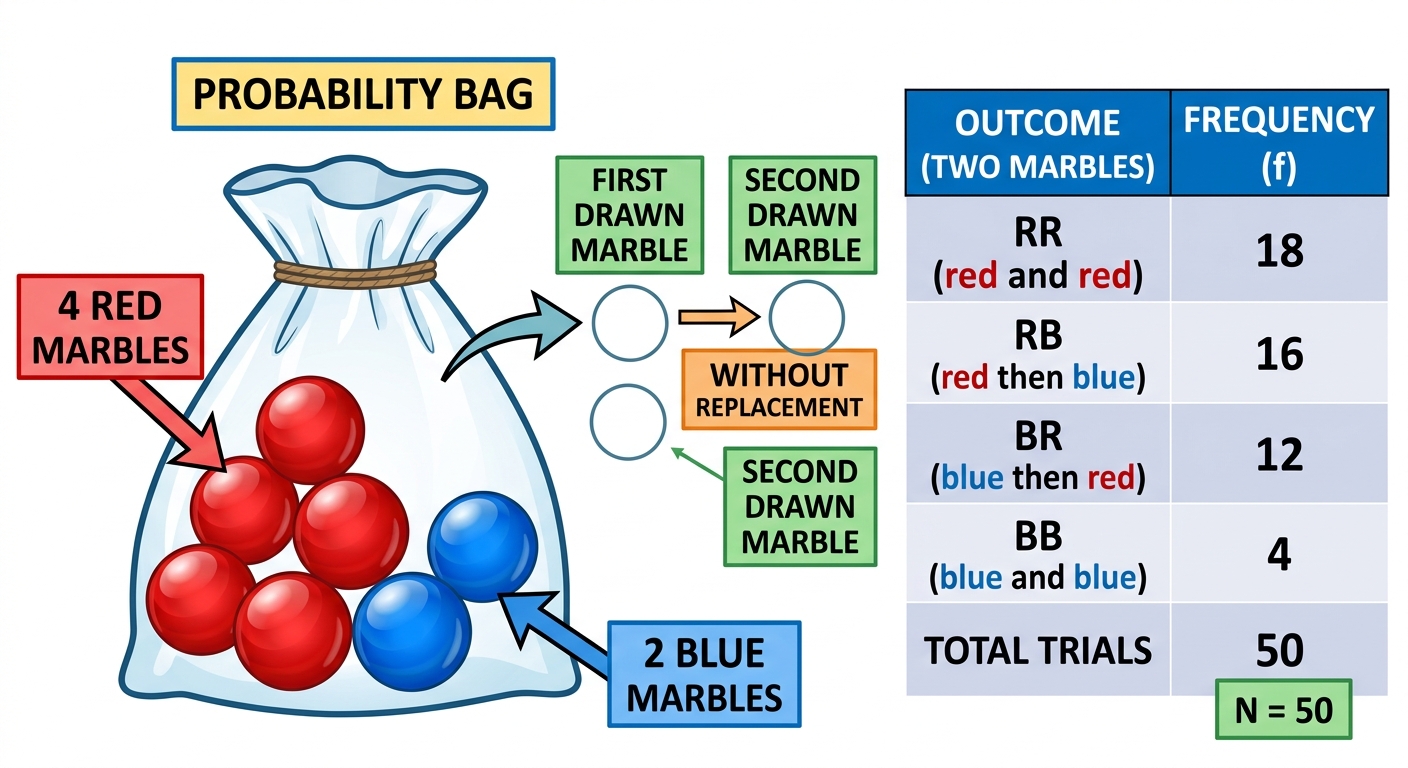
A quality-control technician at a marble factory tests batches by drawing two marbles without replacement from a bag containing 4 red and 2 blue marbles. After 50 trials, the recorded frequencies are:
| Outcome | RR | RB | BR | BB |
|---|---|---|---|---|
| Frequency | 18 | 16 | 12 | 4 |
a
Calculate the experimental probability of each outcome. [1]
b
Construct a tree diagram showing all possible outcomes with their theoretical probabilities, and calculate the theoretical probability of each outcome. [1]
c
Calculate the theoretical and experimental probabilities of drawing "at least one red" marble, and analyse how closely the experimental results match theory. [1]
d
The factory accepts a batch only if the probability of drawing "no reds" is below 0.10. Using your theoretical probabilities, advise the quality-control technician whether this batch should be accepted, and justify your recommendation using the complementary probability. [1]
Solutions
4QuestionCalculating Combined ProbabilitiesAssessment Practice
8 marks~12 minCriterion B
A quality-control technician at a marble factory tests batches by drawing two marbles without replacement from a bag containing equal numbers of red and blue marbles.
Experiment 1: 2 red, 2 blue marbles
Experiment 2: 3 red, 3 blue marbles
Experiment 3: 4 red, 4 blue marbles
Experiment 1: 2 red, 2 blue marbles
Experiment 2: 3 red, 3 blue marbles
Experiment 3: 4 red, 4 blue marbles
a
Calculate the probability of drawing a red marble first and a blue marble second for each experiment. Write each answer as a simplified fraction. [3]
b
Deduce a formula for this probability when the bag contains red and blue marbles, where is a positive integer. [2]
c
The factory considers a batch "well-mixed" if the probability of drawing one marble of each colour (in either order) exceeds . Advise the factory whether this standard is a useful quality-control threshold, justifying your answer algebraically. [3]
Solutions
That's every free question here — 4 of 130.
+126 more questions, plus Mock Papers & Worksheets, are waiting in Premium.