You're viewing free preview questions — 4 questions previewing here — subscribe to unlock 61 more, plus the Full Question Bank, Mock Papers & Worksheets.Upgrade
Trigonometric Graphs and Transformations — Free MYP5 Mathematics (Standard) Practice Questions

1QuestionTransforming Trig Graphs AlgebraicallyConcept Practice
2 marks~3 minCriterion A
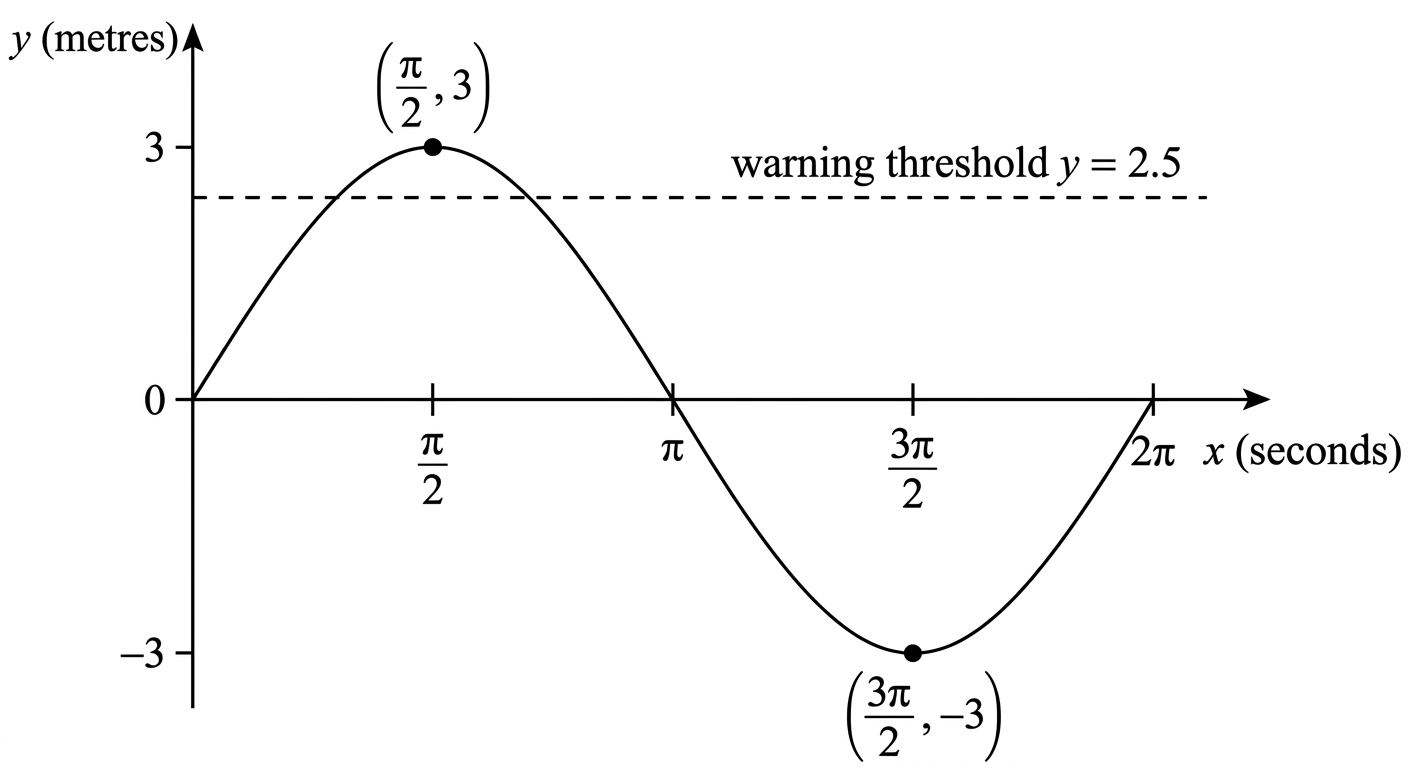
A buoy bobs in the ocean. Its vertical displacement from the water surface is modelled by , where represents time in seconds and represents displacement in metres. The buoy reaches a maximum displacement of m at s and a minimum displacement of m at s.
a
Deduce the value of . [1]
b
The buoy triggers a warning signal when its displacement exceeds m. Justify whether the buoy activates the warning signal, using the model. [1]

Solutions
2QuestionTransforming Trig Graphs AlgebraicallyAssessment Practice
4 marks~6 minCriterion D
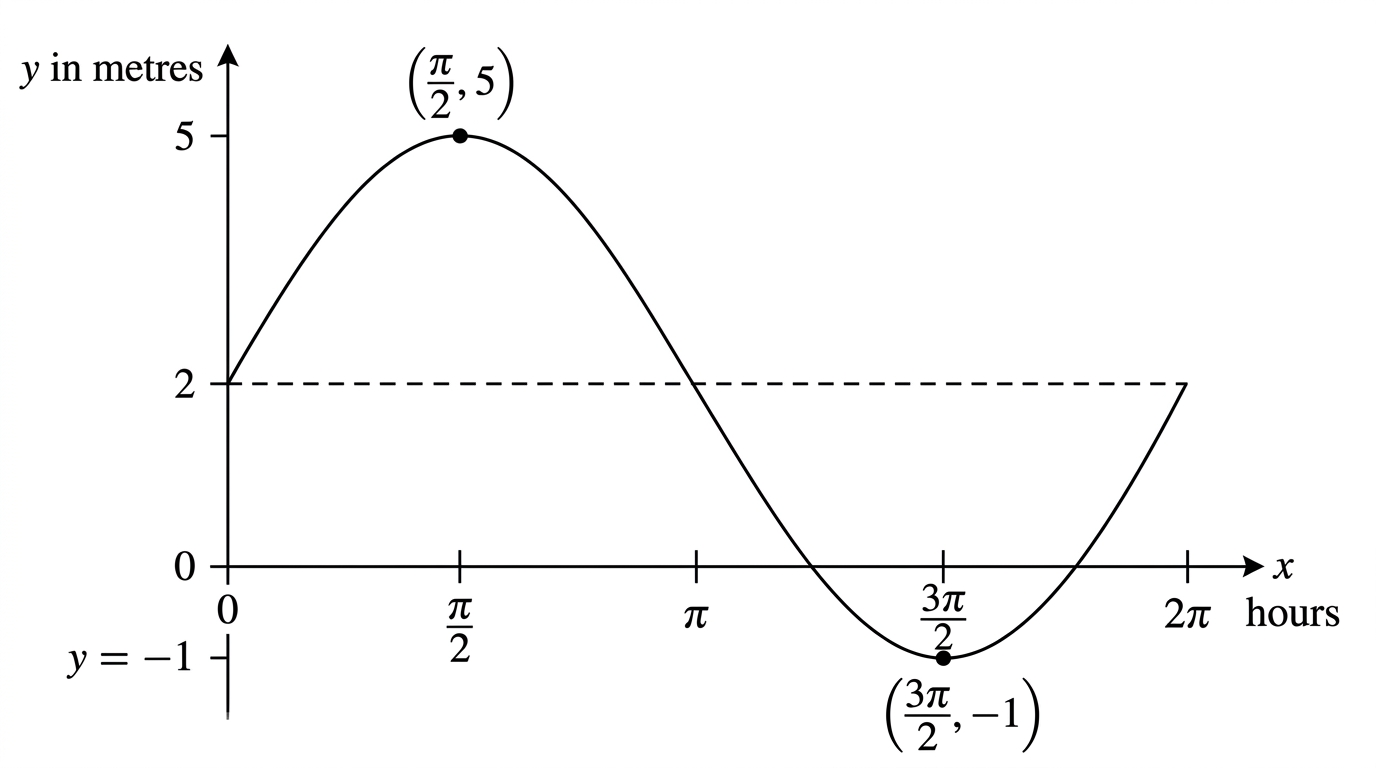
A coastal monitoring buoy records water depth. The depth, in metres, is modelled by , where is time in hours.
a
State the amplitude of and explain what it represents in this context. [1]
b
Deduce the maximum and minimum water depths predicted by this model. [1]
c
Construct a clearly labelled sketch of over one full period, then advise the harbour authority whether the harbour remains operational, given that a minimum water depth of 0 m is required at all times. [2]
Solutions
3QuestionSketching Graphs of y = sin x cos x tan xConcept Practice
4 marks~6 minCriterion B
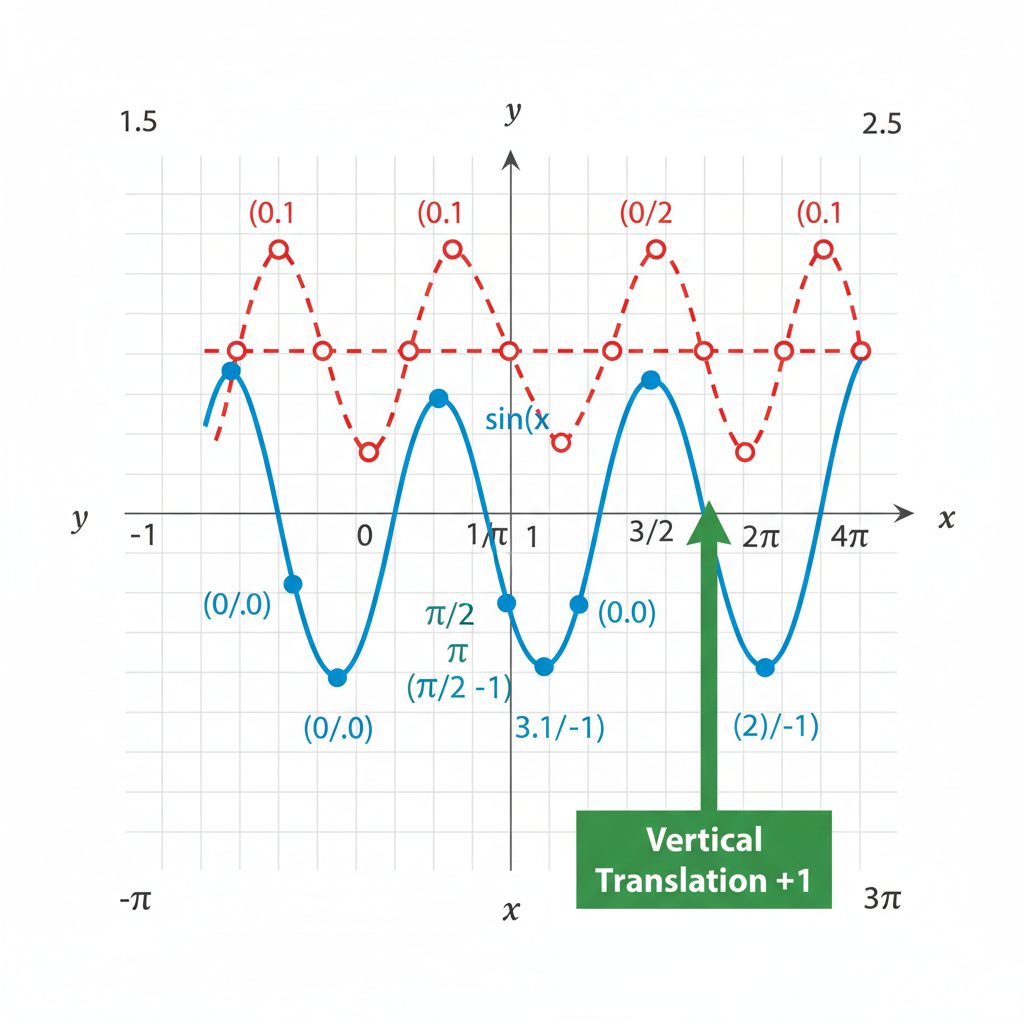
The graph of is shown. A second graph is drawn by adding 1 to each -coordinate of , resulting in .
Coordinates of key points on :
- Maximum:
- Minimum:
- Zero at origin:
Coordinates of key points on :
- Maximum:
- Minimum:
- Zero at origin:
a
Investigate how the -coordinates change from to for these points. Describe the pattern.
b
Generalize this pattern into a rule: what effect does adding a constant to have on its graph?
c
Use your rule to predict the coordinates of the maximum and minimum points on . Then verify by substituting and into .
Solutions
4QuestionSketching Graphs of y = sin x cos x tan xAssessment Practice
4 marks~6 minCriterion C
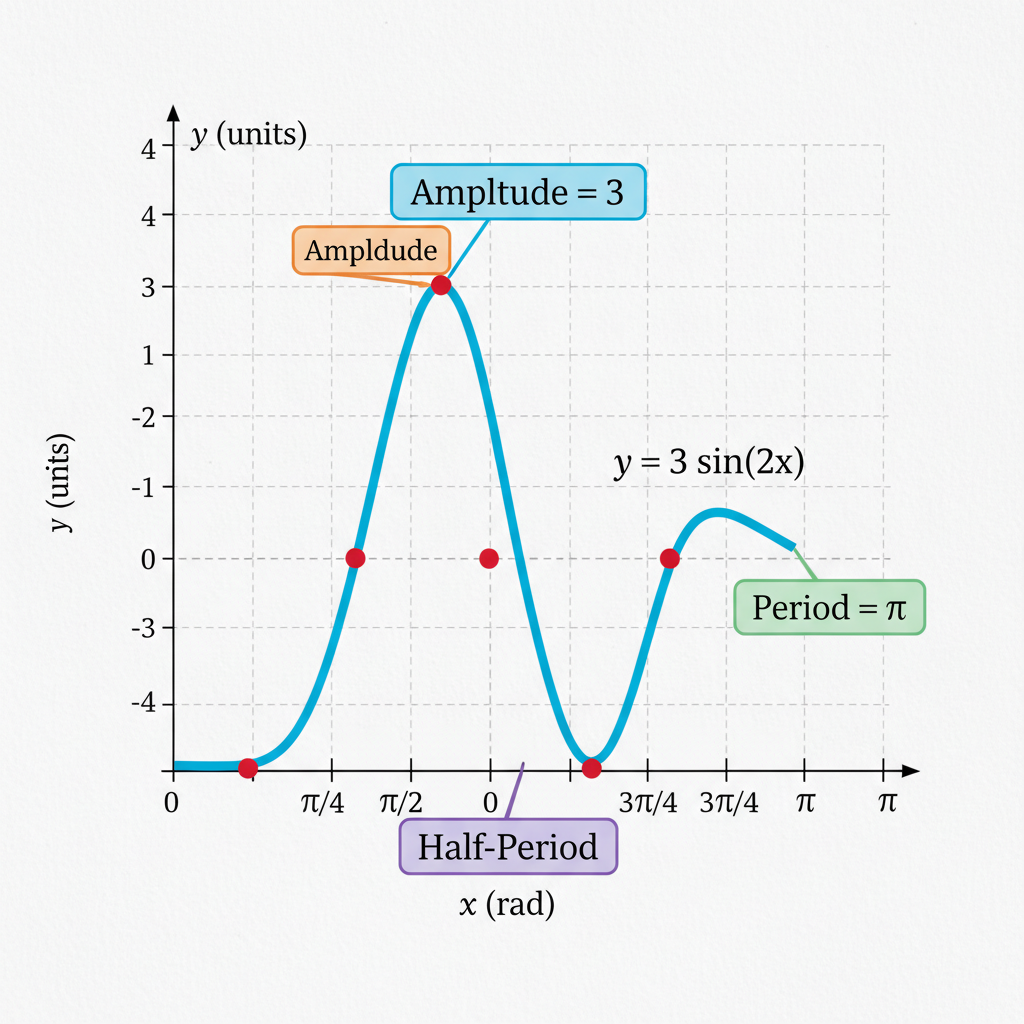
Given the trigonometric function , explain clearly, step-by-step, how to determine its amplitude, period, and principal axis. Then describe how to use these features to sketch one complete cycle of the graph, ensuring you use appropriate mathematical terminology and notation in your explanation.
Solutions
That's every free question here — 4 of 65.
+61 more questions, plus Mock Papers & Worksheets, are waiting in Premium.