You're viewing 4 free preview questions for Maths AI SL — subscribe to unlock 307 more, plus the Full Question Bank, Mock Papers & Worksheets.Upgrade
Inferential Statistics · Paper 1 — Free Maths AI SL Practice Questions
1FoundationSAQ-SRegression analysis5 marksPaper 1~8 min

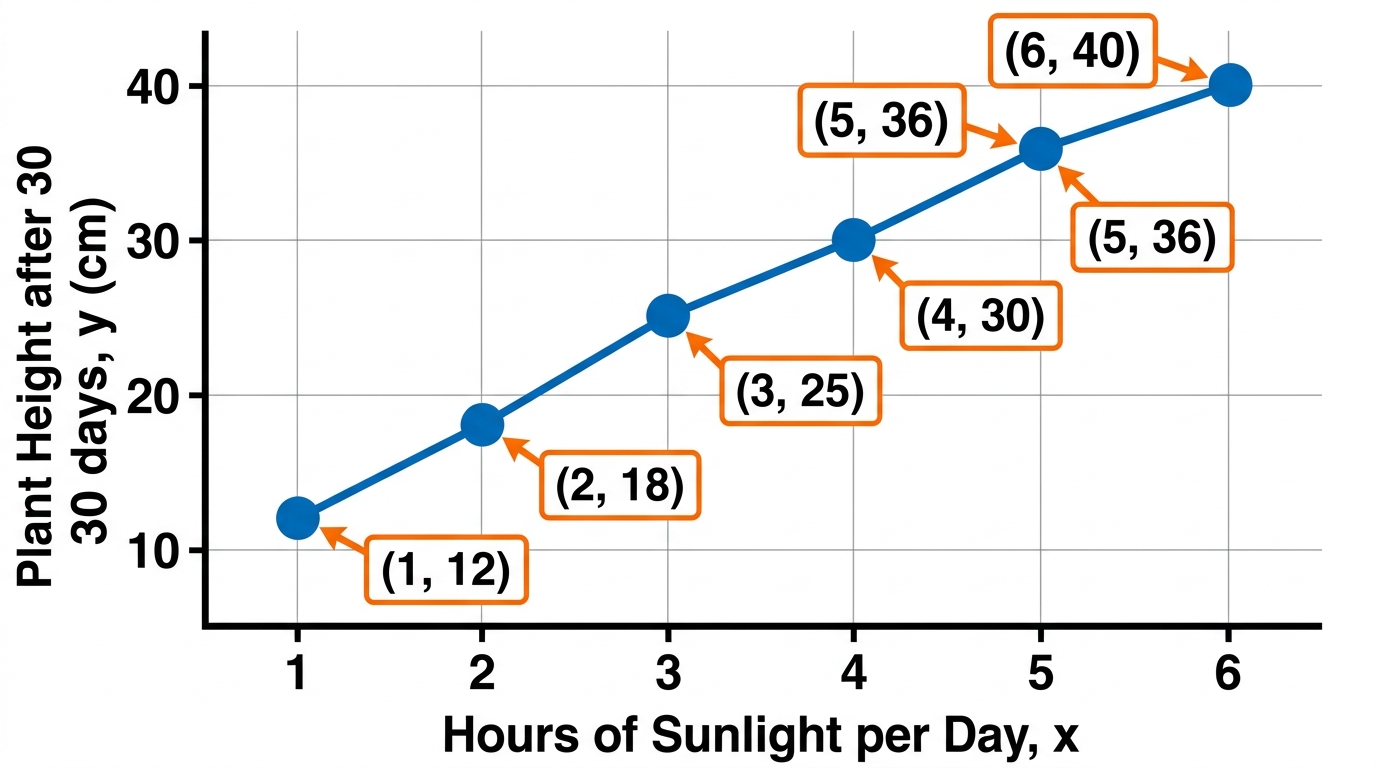
A researcher studies the relationship between the number of hours a plant is exposed to sunlight each day, , and the height of the plant after 30 days, cm. Data collected for six plants is shown below.
x (hours): 1, 2, 3, 4, 5, 6
y (cm): 12, 18, 25, 30, 36, 40
(a)
State the type of regression model that would be most appropriate for this data. [1 mark]
(b)
Calculate the equation of the regression line of on , giving the values of and in correct to three significant figures. [2 marks]
(c)
A plant receives hours of sunlight per day. A student uses the regression equation to predict its height after 30 days and states: "The model predicts a height of cm, so this is a reliable estimate."
Evaluate the reliability of this prediction. [2 marks]

Solutions
2FoundationSAQ-SRegression analysis4 marksPaper 1~6 min
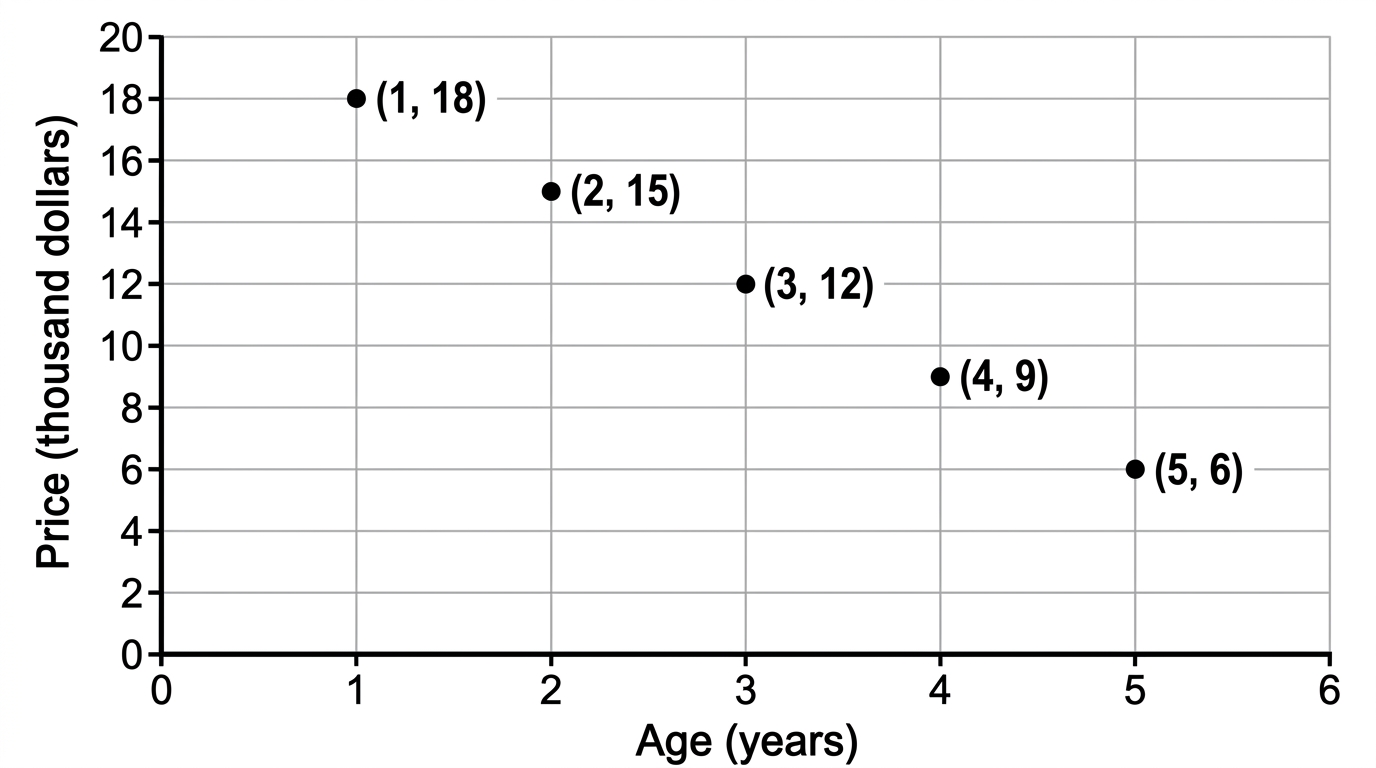
A student investigates the relationship between the age of a car, years, and its selling price, thousand dollars. Data for five cars are shown in the table below.
Age (years) — 1 — 2 — 3 — 4 — 5
Price (thousand dollars) — 18 — 15 — 12 — 9 — 6
The regression line of on is .
(a)
State the type of correlation between the age and selling price of a car. [1 mark]
(b)
A car is 4.5 years old. Calculate its predicted selling price in dollars. [2 marks]
(c)
The actual selling price of the 4.5-year-old car is USD 6000.
(i) Calculate the residual for this car in dollars. [1]
(ii) State what the sign of the residual indicates about the regression line's prediction for this car. [1 mark]
(ii) State what the sign of the residual indicates about the regression line's prediction for this car. [1 mark]
Solutions
3MasterySAQ-SRegression analysis5 marksPaper 1~8 min
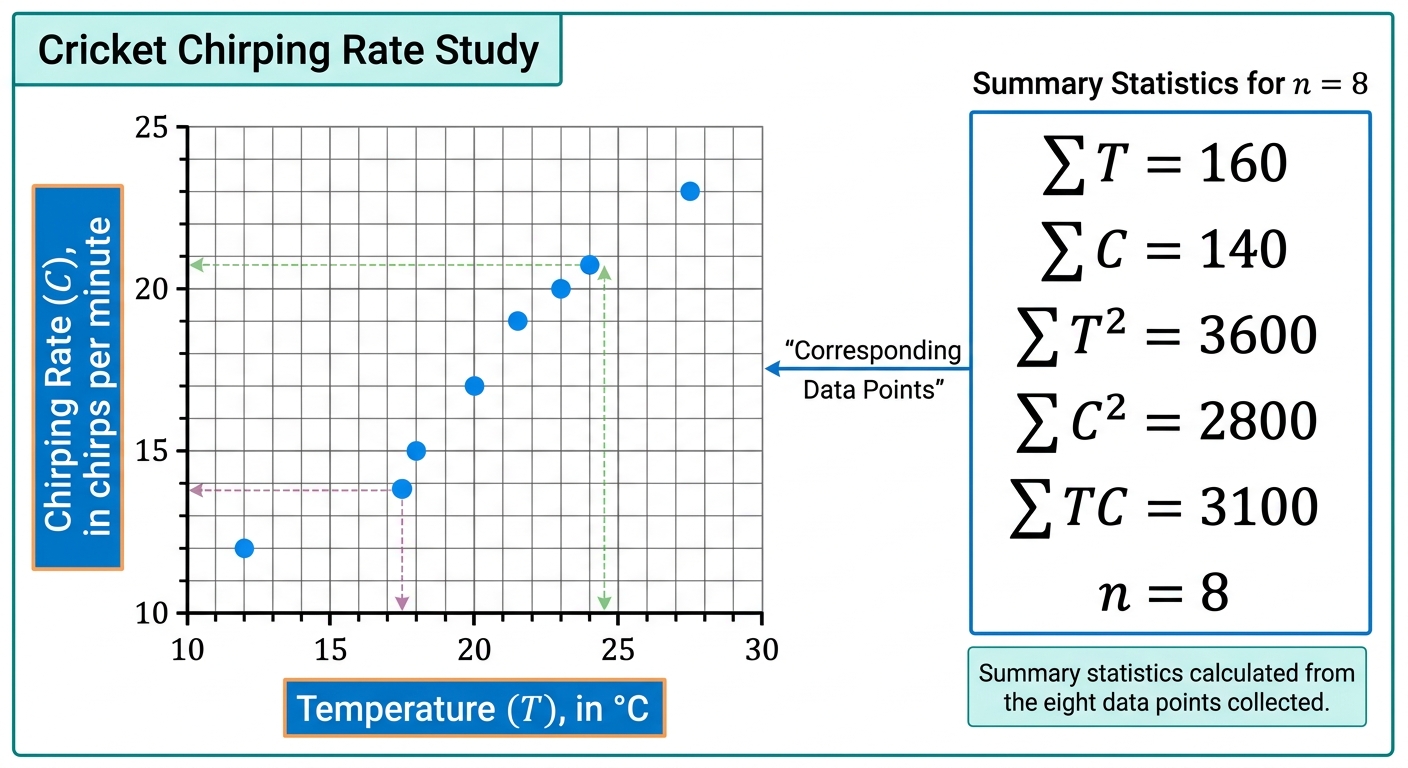
A biologist studies the relationship between temperature (, in °C) and chirping rate (, in chirps per minute) of a species of cricket. She collects data for temperatures and obtains the following summary statistics:
(a)
Show that the Pearson correlation coefficient , correct to 1 decimal place. [3 marks]
(b)
Calculate the coefficient of determination . [1 mark]
(c)
Hence explain what the value of indicates about the relationship between temperature and chirping rate. [1 mark]
Solutions
4ChallengeSAQ-LRegression analysis8 marksPaper 1~12 min
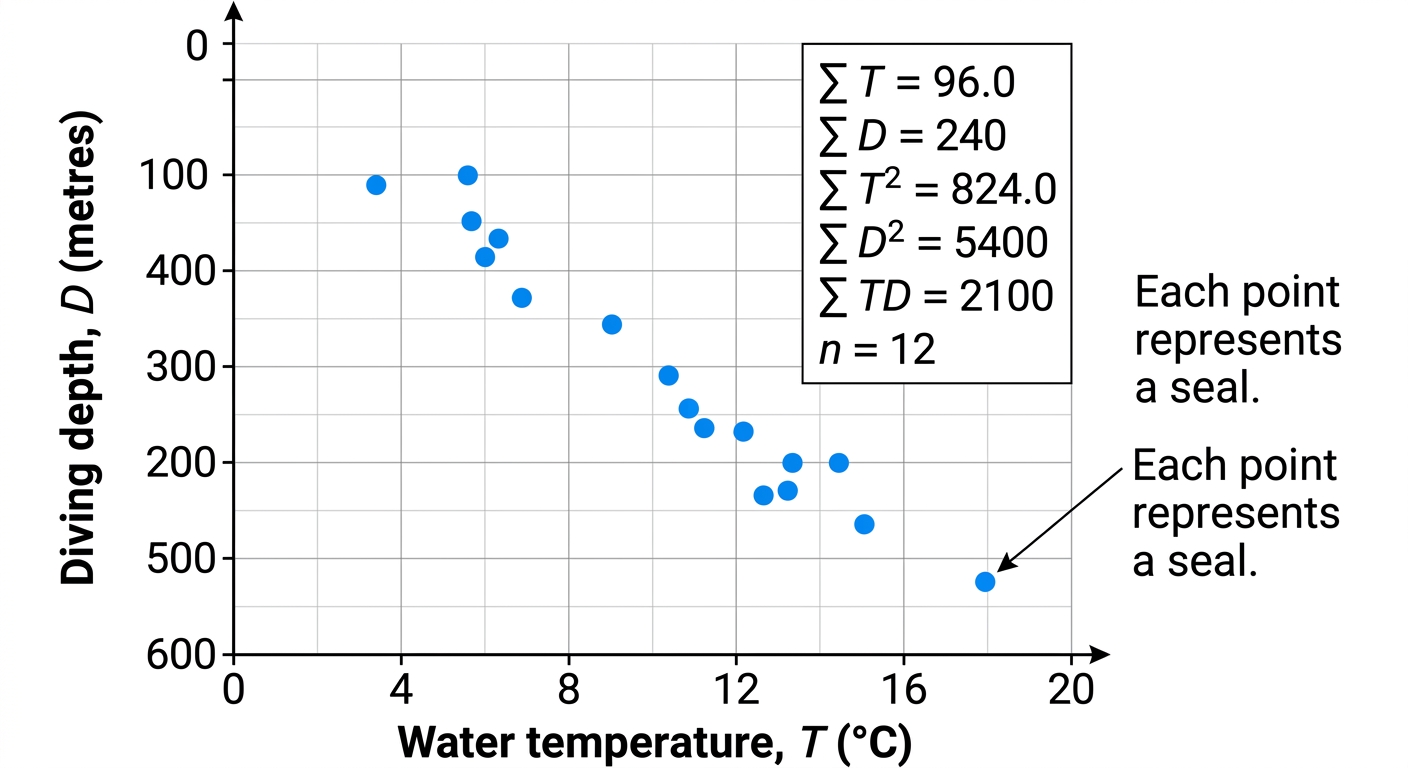
A marine biologist studies the relationship between water temperature (, in °C) and diving depth (, in metres) for a species of seal. Data from seals give the following summary statistics:
(a)
Calculate the Pearson correlation coefficient , correct to three significant figures. [2 marks]
(b)
Determine the equation of the regression line of on in the form , with and correct to three significant figures. [2 marks]
(c)
Use your regression line to estimate the diving depth when , giving your answer correct to the nearest metre. [1 mark]
(d)
The biologist claims: "Temperature is a good predictor of diving depth because the correlation is strong."
Evaluate this claim. In your response, refer to your value of , the reliability of the regression model within the data range, and one limitation of using this model.
The following formulae are provided:
[3 marks]
Solutions
That's every free question here — 4 of 311.
+307 more questions, plus Mock Papers & Worksheets, are waiting in Premium.