You're viewing free preview questions — 4 questions previewing here — subscribe to unlock 56 more, plus the Full Question Bank, Mock Papers & Worksheets.Upgrade
Using Tree Diagrams and Venn Diagrams Introductory — Free MYP2 Mathematics Practice Questions

1QuestionCalculating Basic Probabilities Using Tree DiagramsConcept Practice
2 marks~3 minCriterion A
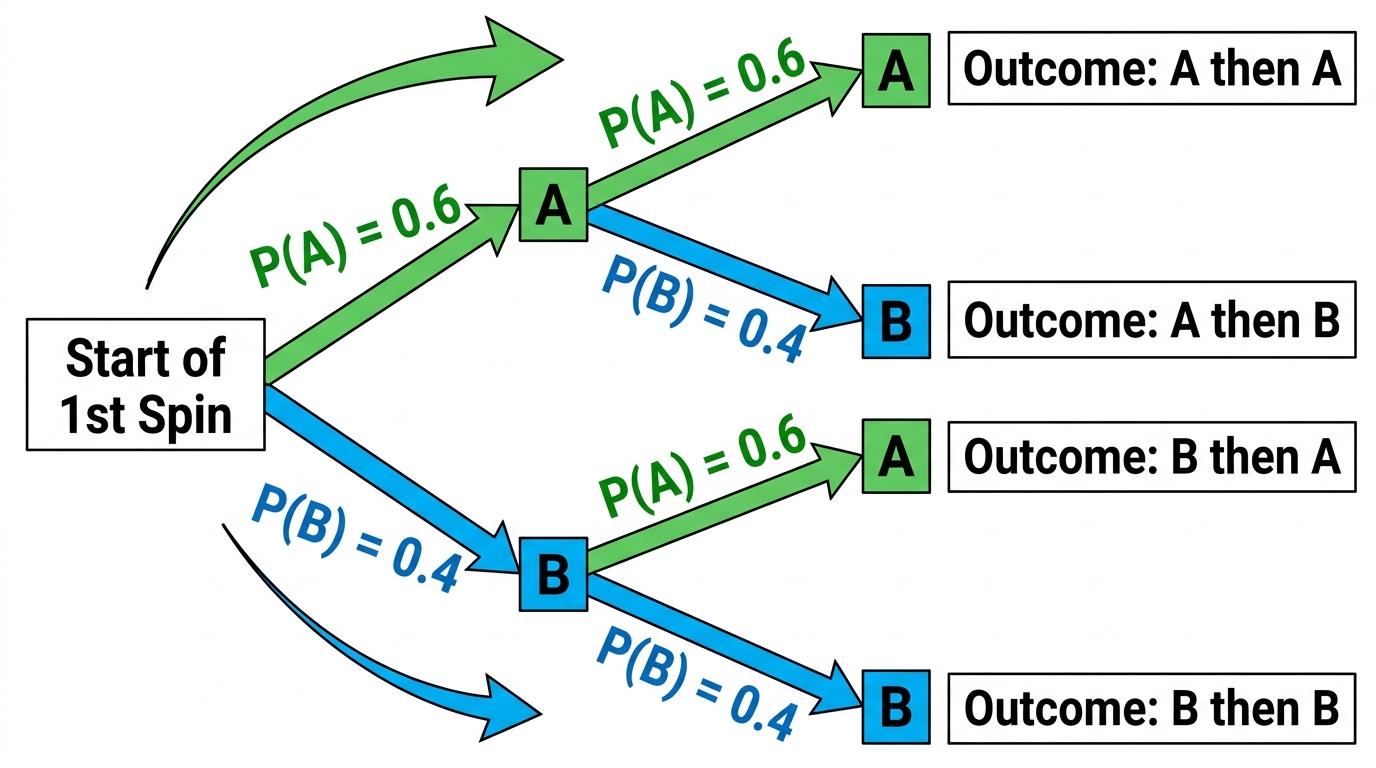
A spinner has two sections, and . The probability of landing on is and the probability of landing on is for each spin. The spinner is spun twice.
a
Identify the probability of landing on on the first spin and on the second spin. [1]
b
Calculate . [1]

Solutions
2QuestionExploring Overlapping and Disjoint EventsAssessment Practice
2 marks~3 minCriterion D
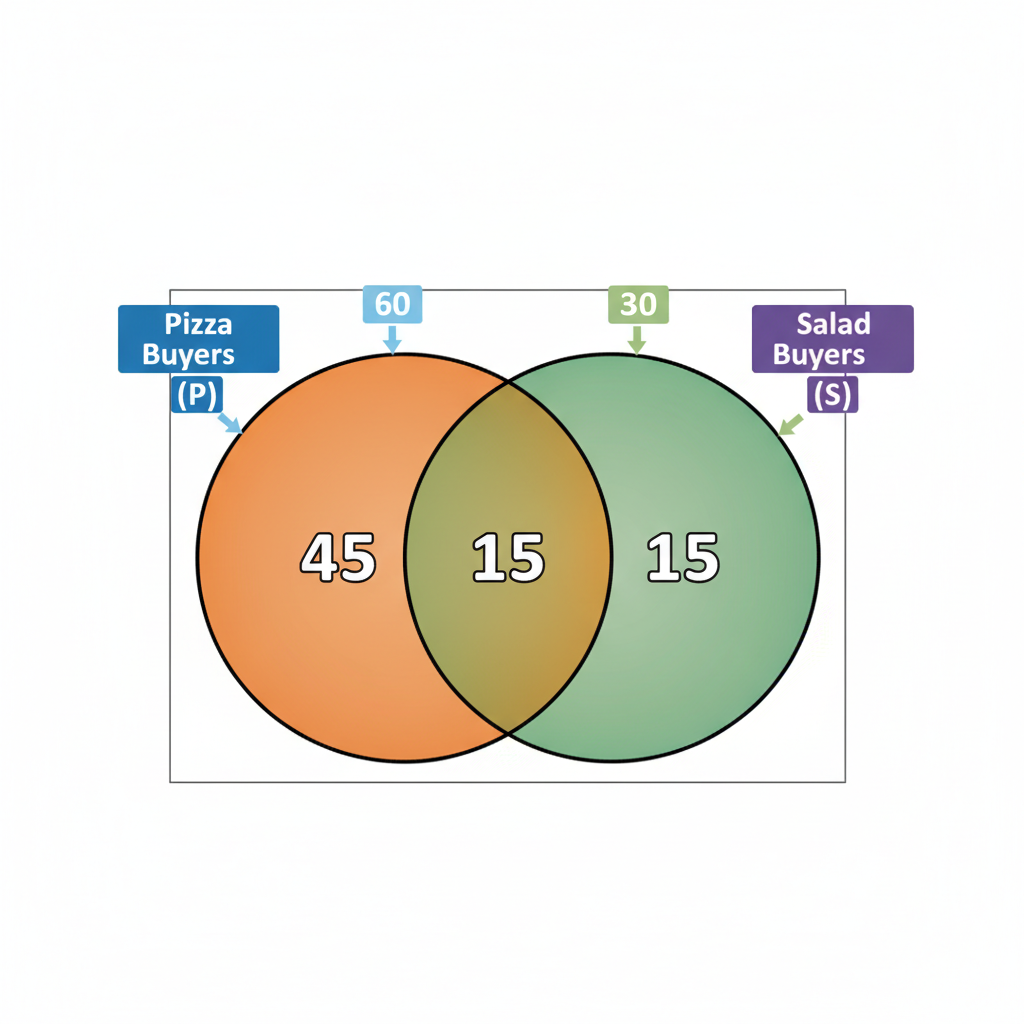
A school cafeteria manager records that 60 students buy pizza, 30 buy salad, and 15 buy both.
a
Describe one way this data helps the manager decide how much food to prepare. [1]
b
Identify one limitation of using a Venn diagram to plan food orders, and explain why it creates a problem. [1]
Solutions
3QuestionUnderstanding Tree Diagrams for Two EventsAssessment Practice
5 marks~8 minCriterion C
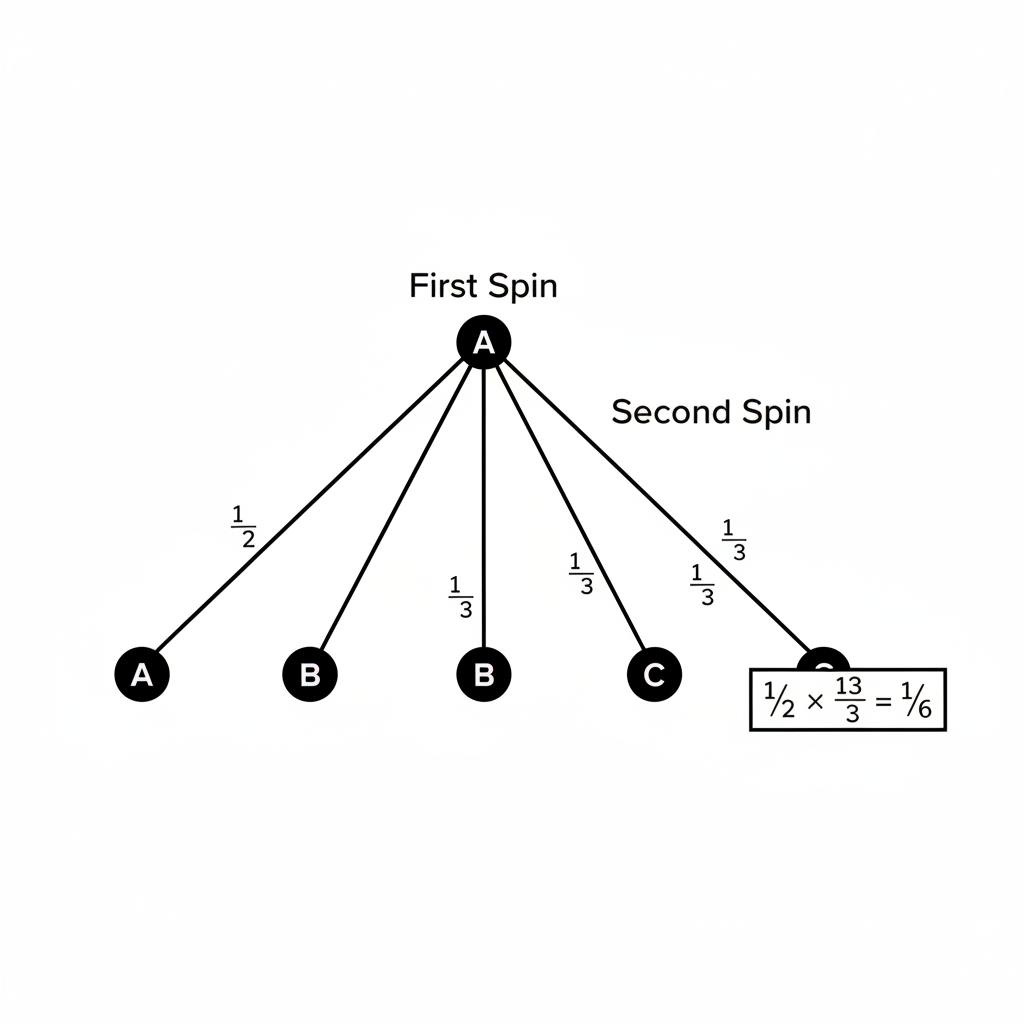
A fair spinner has three equal sections labelled A, B, and C. It is spun twice. A student's tree diagram shows the probability of A on the first spin as and on the second spin as , giving .
a
Identify the error in the tree diagram. [1]
b
Calculate the correct probability of getting A on both spins. Show your working using the multiplication rule for independent events (where the result of one spin does not affect the other). [2]
c
A classmate says: "It doesn't matter which spin has the wrong probability — the final answer is close enough to , so the error is not important." Compare the two probabilities and explain why the error does matter. [2]
Solutions
4QuestionInterpreting Simple Venn DiagramsAssessment Practice
6 marks~9 minCriterion B
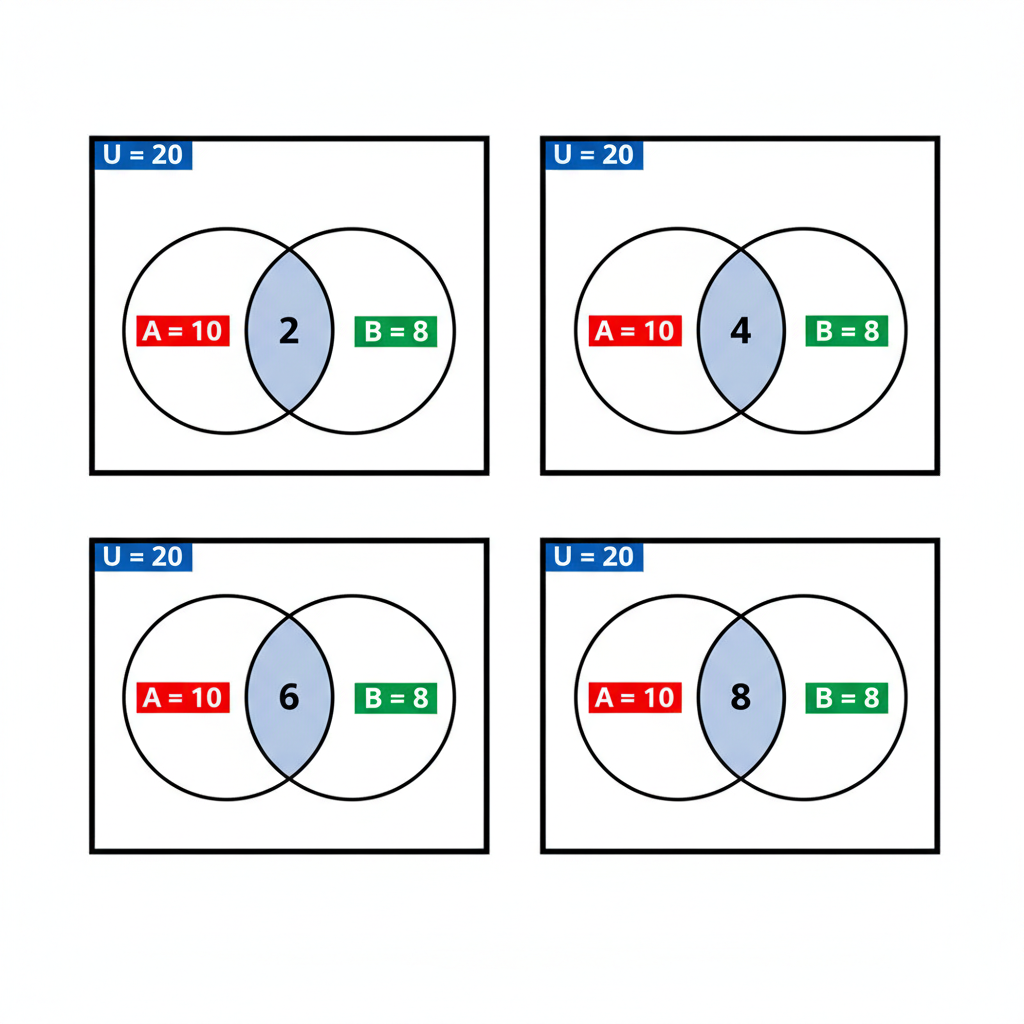
A Venn diagram shows two sets, and , inside a universal set of 20 elements, where and .
a
The intersection (the overlap of and ) contains 6 elements. Calculate , the total number of elements in or . [2]
b
The table below shows four diagrams with different intersection sizes.
: 2, 4, 6, 8
(complement): ?, ?, ?, ?
Calculate the complement size for each intersection value. Describe the pattern you notice. [3]
: 2, 4, 6, 8
(complement): ?, ?, ?, ?
Calculate the complement size for each intersection value. Describe the pattern you notice. [3]
c
A fifth diagram has . Using your pattern, estimate the complement size and explain why your answer is reasonable. [1]
Solutions
That's every free question here — 4 of 60.
+56 more questions, plus Mock Papers & Worksheets, are waiting in Premium.