You're viewing free preview questions — 4 questions previewing here — subscribe to unlock 80 more, plus the Full Question Bank, Mock Papers & Worksheets.Upgrade
Friction Air Resistance and Drag — Free MYP2 Sciences Practice Questions

1QuestionAdvantages and Disadvantages of FrictionConcept Practice
2 marks~3 minCriterion A
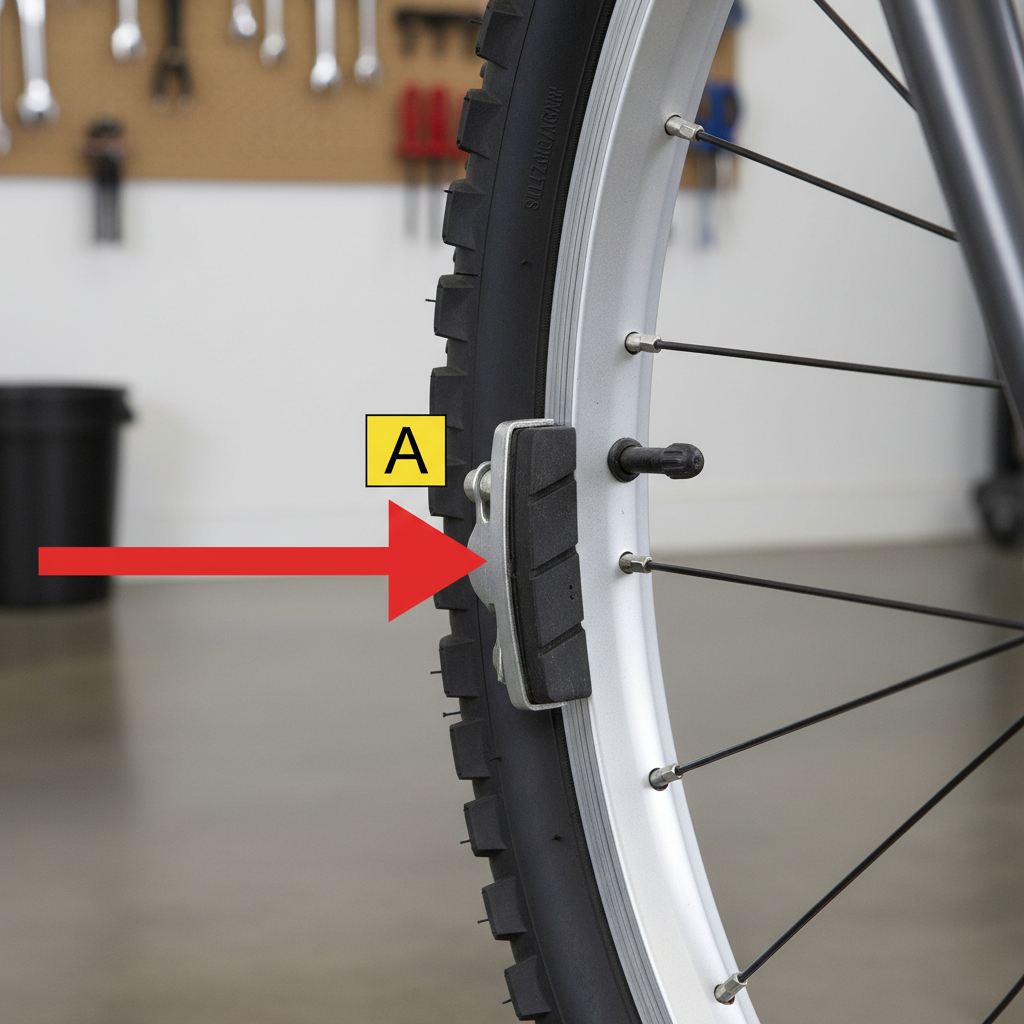
The diagram shows a bicycle brake system. An arrow points to the component that presses against the wheel rim when the brakes are applied.
a
Identify the component indicated by the arrow. [1]
b
Describe how this component uses friction to slow the bicycle. [1]

Solutions
2QuestionReducing Friction in MachinesAssessment Practice
5 marks~8 minCriterion C
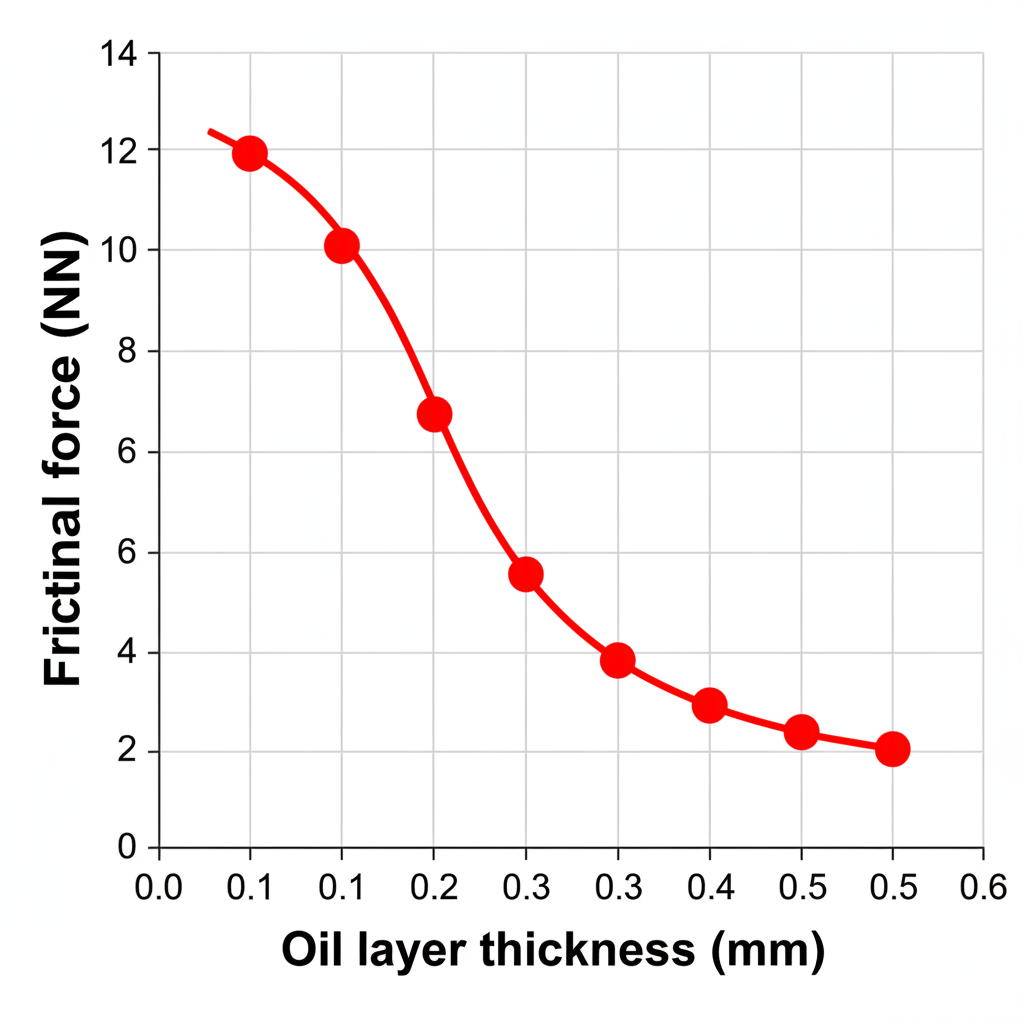
The graph below shows how the frictional force on a machine part changes as the thickness of the oil layer (lubricant) on its surface increases.
Data points — Oil layer thickness (mm) / Frictional force (N): 0.0 / 12.0, 0.1 / 8.5, 0.2 / 5.5, 0.3 / 3.5, 0.4 / 2.5, 0.5 / 2.0
Data points — Oil layer thickness (mm) / Frictional force (N): 0.0 / 12.0, 0.1 / 8.5, 0.2 / 5.5, 0.3 / 3.5, 0.4 / 2.5, 0.5 / 2.0
a
Describe the trend shown by the graph. [2]
b
Explain why a thicker oil layer reduces friction. Refer to the surfaces and the oil particles in your answer. [2]
c
A engineer suggests that increasing the oil layer beyond 0.5 mm will greatly reduce friction further. Using the graph, state whether you agree and give one reason. [1]
Solutions
3QuestionAdvantages and Disadvantages of FrictionConcept Practice
2 marks~3 minCriterion B
A student rolls a toy car down a ramp onto three surfaces — carpet, tile, and sandpaper — and measures how far the car travels each time. The ramp height stays the same for every trial.
a
Identify the independent variable in this investigation. [1]
b
Identify one factor that must be kept constant to make this a fair test, and explain why changing it would affect the results. [1]
Solutions
4QuestionAdvantages and Disadvantages of FrictionAssessment Practice
6 marks~9 minCriterion D
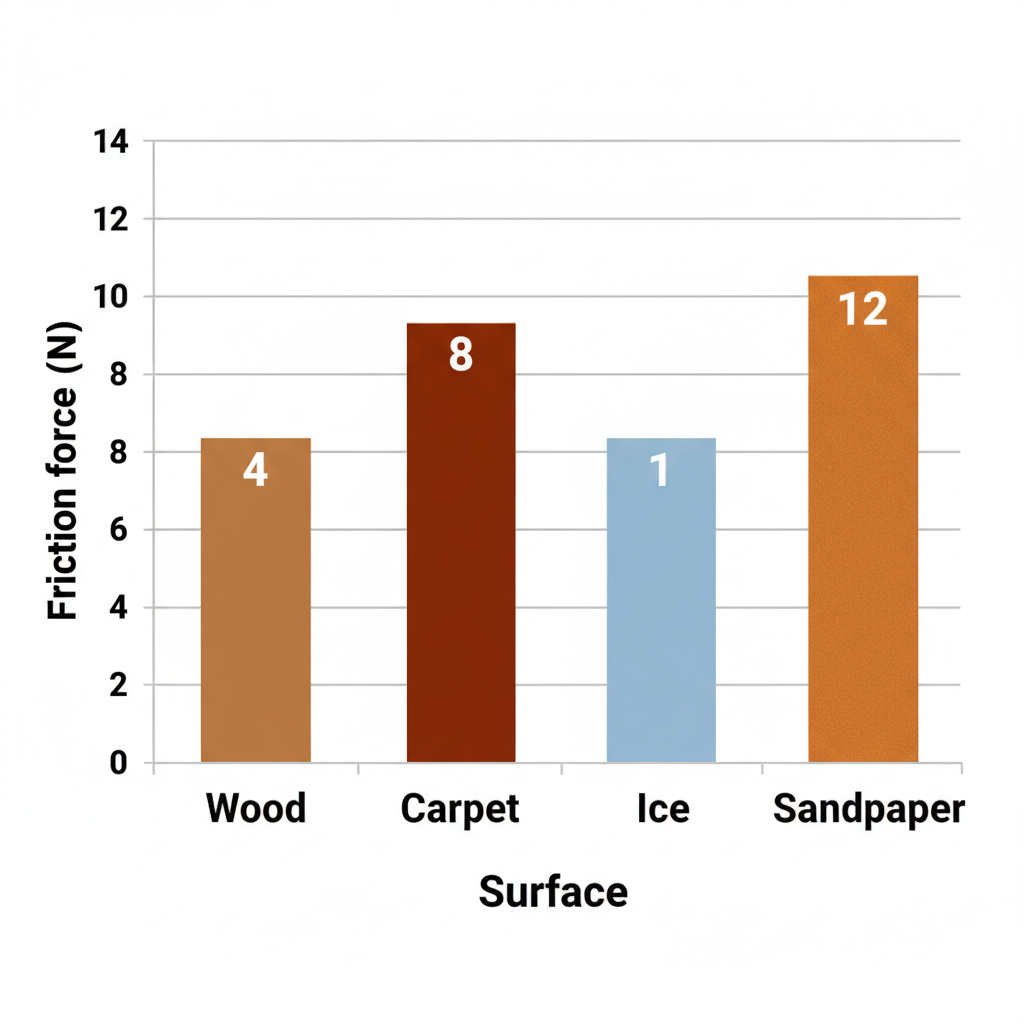
A 1 kg block is pulled at constant speed across four surfaces. The bar graph shows the friction force measured for each surface.
Friction force (N): Wood = 4, Carpet = 8, Ice = 1, Sandpaper = 12
Friction force (N): Wood = 4, Carpet = 8, Ice = 1, Sandpaper = 12
a
Identify the surface with the highest friction force and the surface with the lowest friction force. [2]
b
Explain how the data shows that friction depends on the type of surface. Use values from the graph in your answer. [2]
c
For each situation below, state whether the friction shown in the data is an advantage or a disadvantage, and explain why using a value from the graph.
(i) A person wearing rubber-soled shoes walks across a carpeted floor. [2]
(ii) A person pushes a sled across ice. [2]
(i) A person wearing rubber-soled shoes walks across a carpeted floor. [2]
(ii) A person pushes a sled across ice. [2]
Solutions
That's every free question here — 4 of 84.
+80 more questions, plus Mock Papers & Worksheets, are waiting in Premium.