You're viewing free preview questions — 4 questions previewing here — subscribe to unlock 53 more, plus the Full Question Bank, Mock Papers & Worksheets.Upgrade
Motion Graphs Distance-Time — Free MYP2 Sciences Practice Questions

1QuestionConstant Speed vs Changing SpeedConcept Practice
3 marks~5 minCriterion A
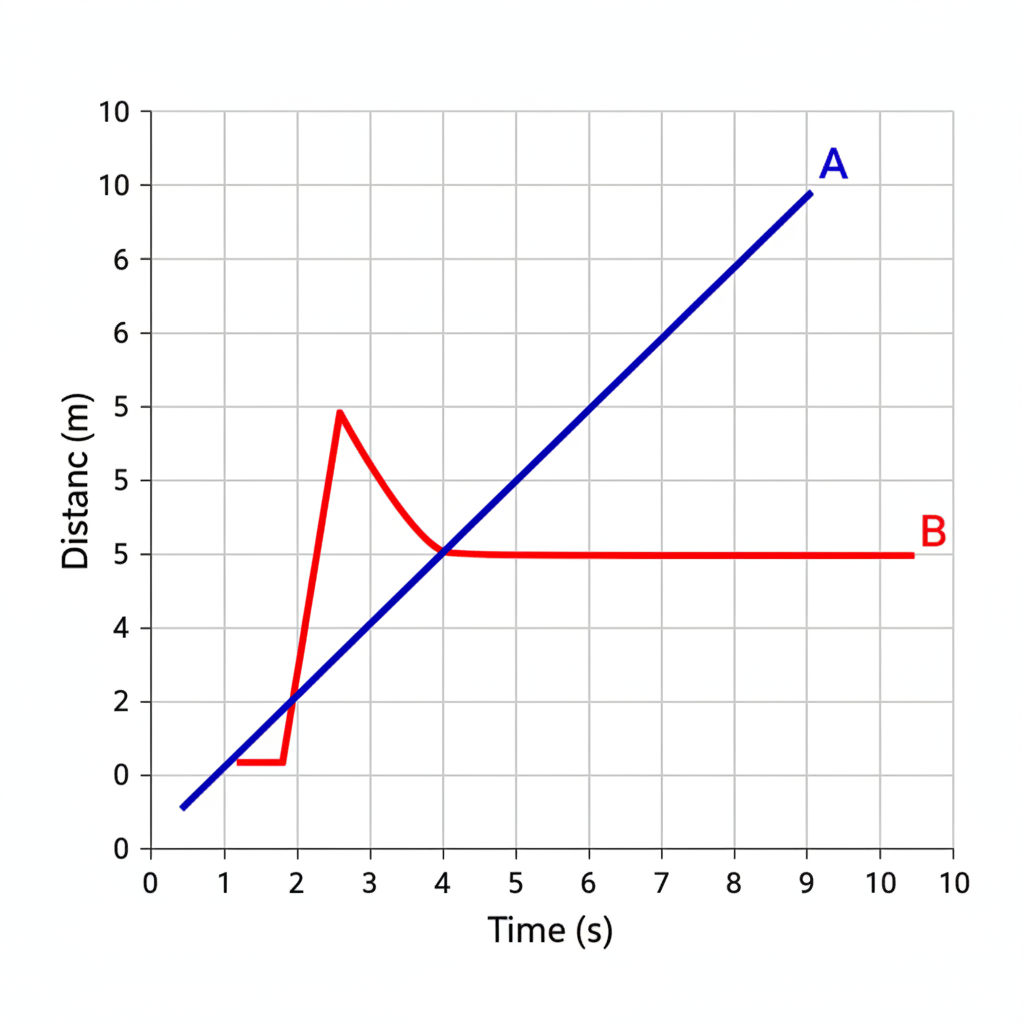
The distance-time graph shows two lines starting at the origin. Line A is straight and slopes upward. Line B curves steeply upward, then levels off.
a
Identify which line represents an object moving at constant speed. [1]
b
Explain how the shape of that line shows the speed is constant. [2]

Solutions
2QuestionMatching Graphs to Real-World ScenariosAssessment Practice
4 marks~6 minCriterion D
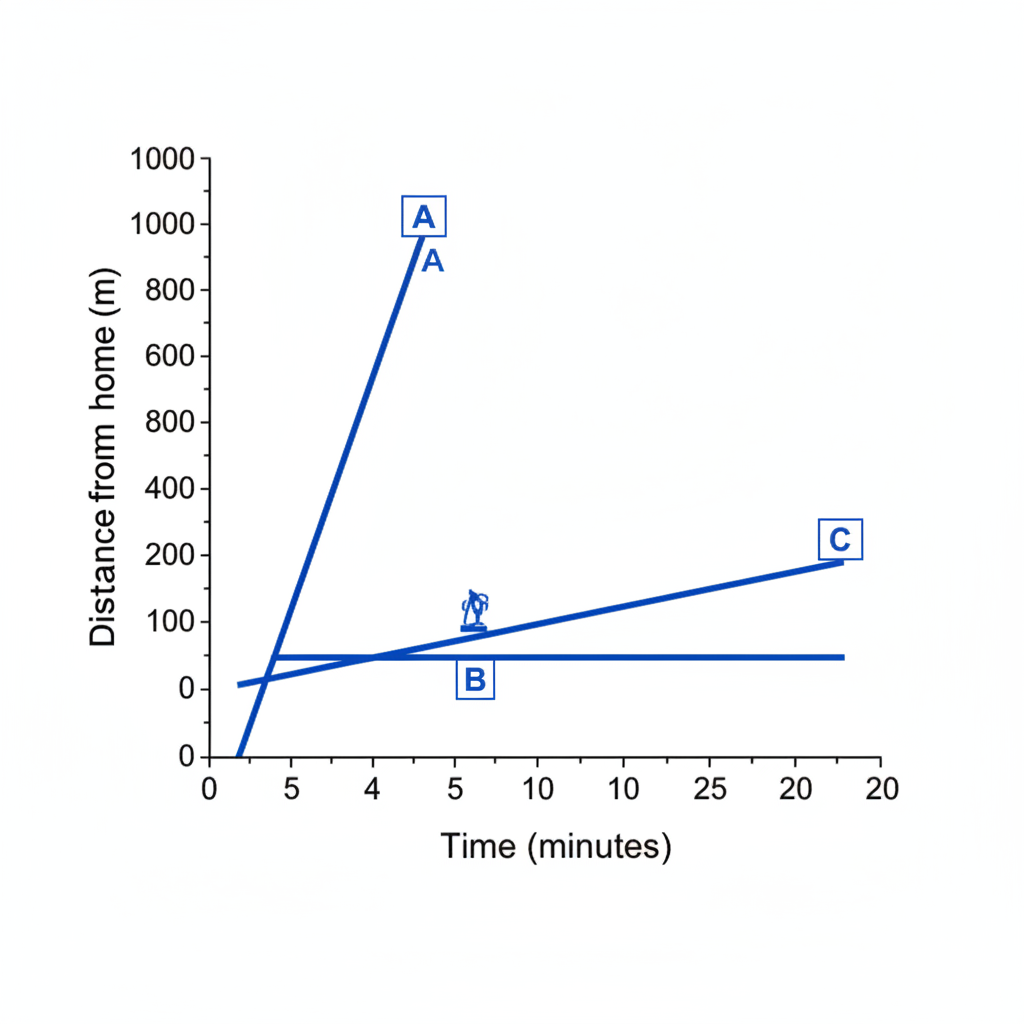
A student walks to school. The distance-time graph shows three sections: A (steep upward slope), B (horizontal line), and C (less steep upward slope).
a
Identify which section (A, B, or C) matches each part of the journey: walking at a steady pace, stopping to tie a shoe, walking at a slower steady pace. [2]
b
Explain ONE limitation of using a distance-time graph to model a real walking journey. [2]
Solutions
3QuestionConstant Speed vs Changing SpeedConcept Practice
3 marks~5 minCriterion B
Two objects, A and B, travel the following distances over time.
| Time (s) | 0 | 2 | 4 | 6 | 8 |
|---|---|---|---|---|---|
| Object A (m) | 0 | 4 | 8 | 12 | 16 |
| Object B (m) | 0 | 2 | 6 | 8 | 14 |
a
Describe the pattern in the distance values for Object A. [1]
b
Identify which object moves at constant speed (equal distance covered in equal time intervals) and which moves at changing speed. [1]
c
Compare the motion of Object A and Object B using values from the data to support your answer. [1]
Solutions
4QuestionDrawing Graphs from DescriptionsAssessment Practice
5 marks~8 minCriterion C
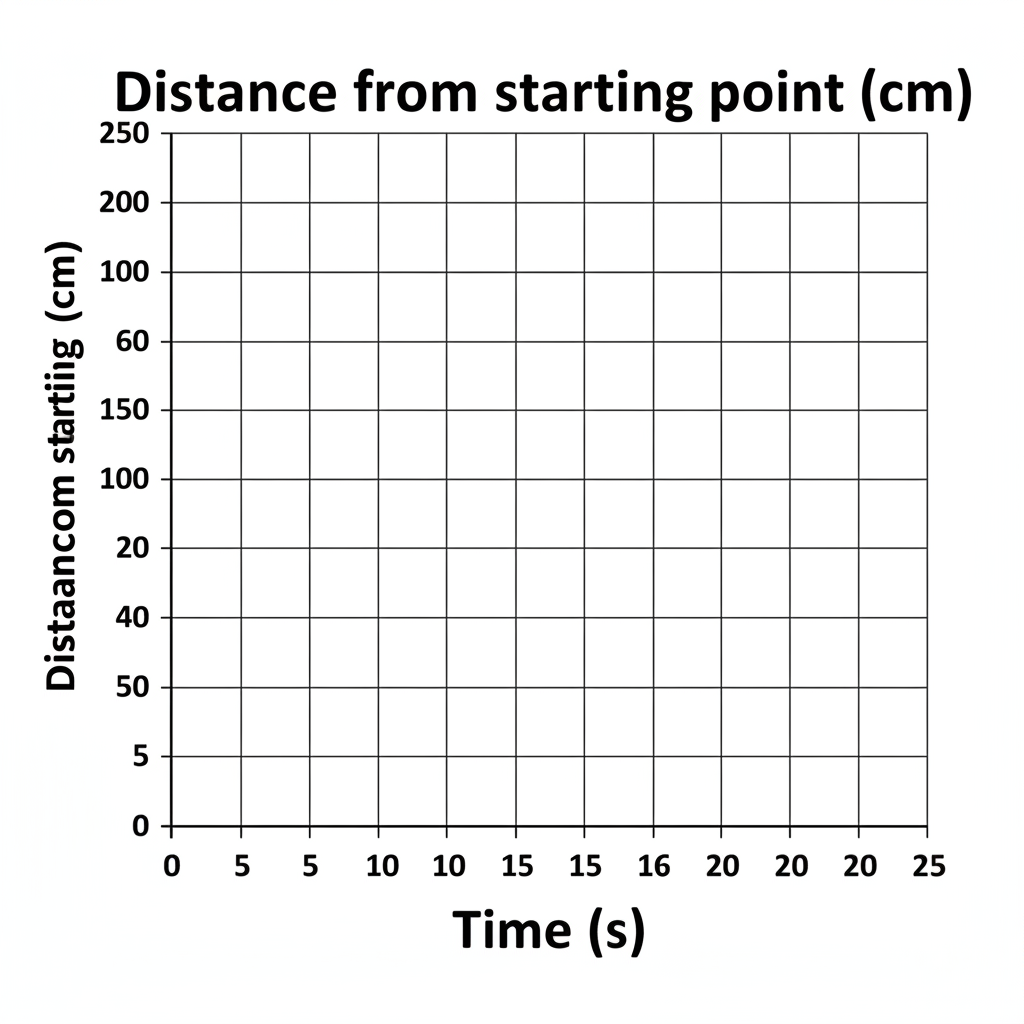
A toy car travels at a constant speed (meaning it does not change) of 20 cm/s for 10 s, stops for 5 s, then returns to its starting point at 10 cm/s.
a
Identify the distance the car travels in the first 10 s. [1]
b
On the axes provided, draw and label a distance–time graph for the first two sections of the journey (0 s to 15 s). [2]
c
The student claims the car returns to its starting point during the journey. Using your graph and a calculation, explain whether this claim is correct. [2]
Solutions
That's every free question here — 4 of 57.
+53 more questions, plus Mock Papers & Worksheets, are waiting in Premium.