You're viewing free preview questions — 4 questions previewing here — subscribe to unlock 67 more, plus the Full Question Bank, Mock Papers & Worksheets.Upgrade
Structure of the Earth — Free MYP3 Sciences Practice Questions

1QuestionHow Earth Structure Affects LandformsConcept Practice
2 marks~3 minCriterion A
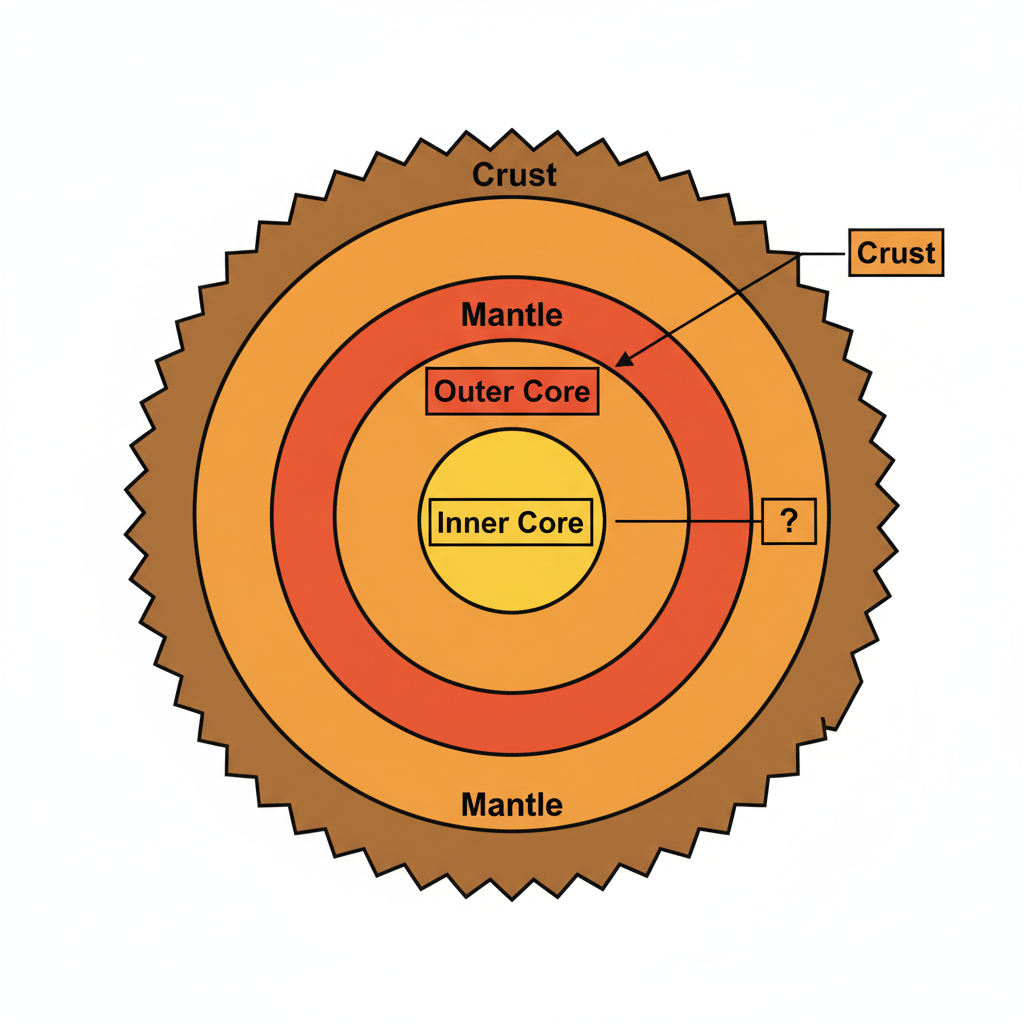
The diagram shows a cross-section of the Earth with its layers labelled. Layer X is the layer directly beneath the crust.
a
Identify layer X. [1]
b
Explain why layer X is important for the movement of tectonic plates. [1]

Solutions
2QuestionLayers of the Earth Crust Mantle CoreAssessment Practice
2 marks~3 minCriterion D
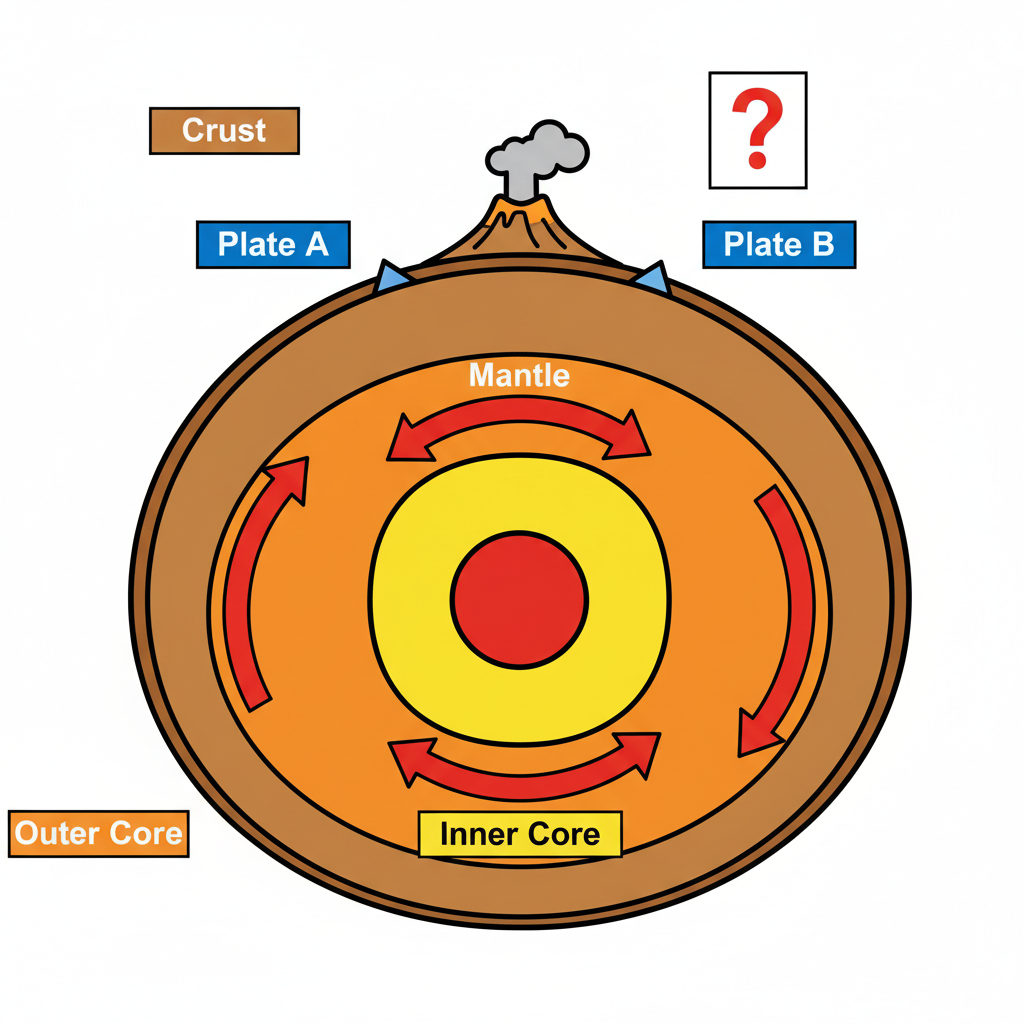
The diagram shows a cross-section of Earth's interior with arrows indicating convection currents in the mantle.
a
Describe how convection currents in the mantle cause tectonic plates to move. [1]
b
Explain one reason why the mantle convection model cannot precisely predict the location of a future volcanic eruption. [1]
Solutions
3QuestionLayers of the Earth Crust Mantle CoreAssessment Practice
3 marks~5 minCriterion C
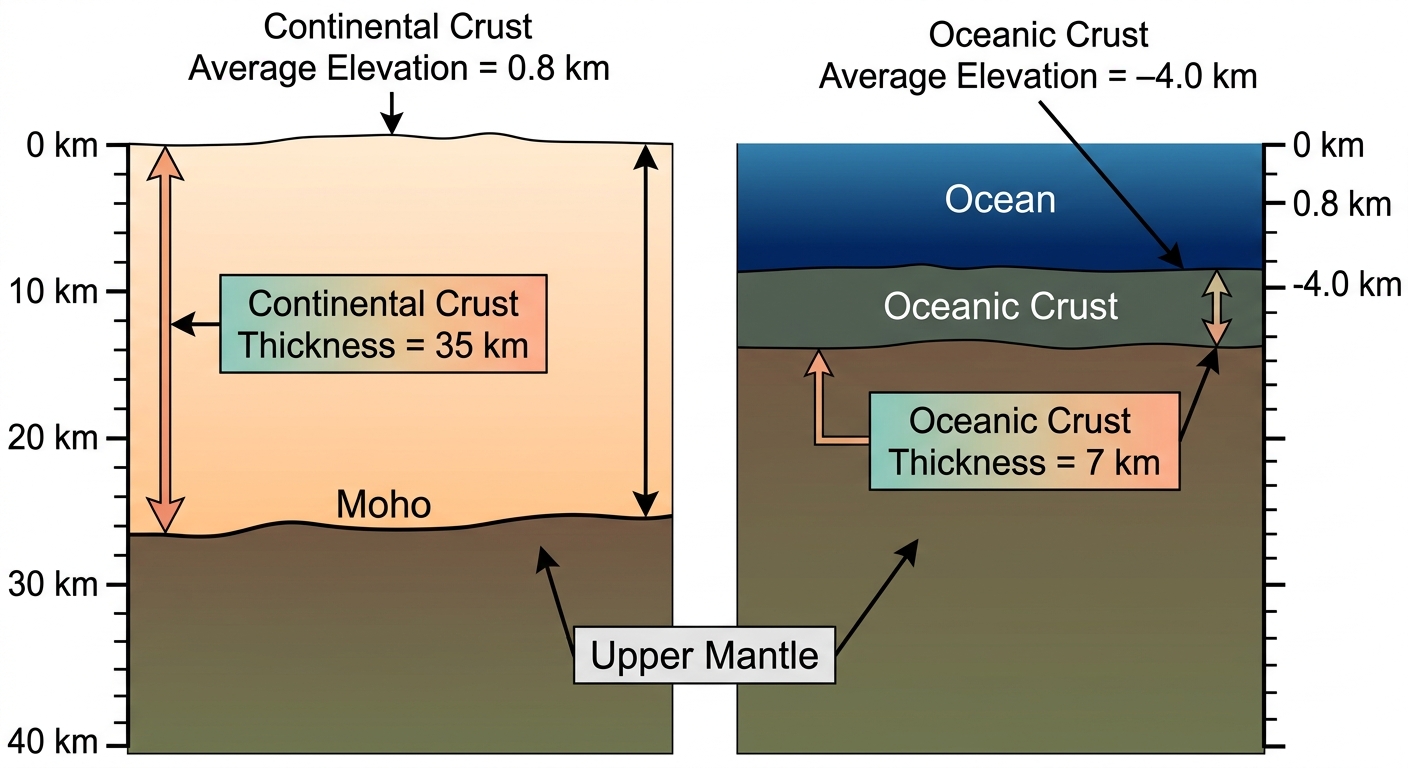
The table below shows average data for continental and oceanic crust.
| Continental crust — thickness | 35 km | elevation: +0.8 km |
|---|---|---|
| Oceanic crust — thickness | 7 km | elevation: −4.0 km |
a
Describe the relationship between crustal thickness and elevation shown in the data. [1]
b
Explain how the difference in density between continental and oceanic crust causes them to float at different heights on the mantle. [1]
c
A geologist claims that a newly discovered crust sample is oceanic. It has a thickness of 30 km and an elevation of +0.5 km. Using the data above, evaluate whether this claim is likely to be correct. [1]
Solutions
4QuestionTectonic Plates and Plate Boundaries IntroductoryAssessment Practice
7 marks~11 minCriterion B
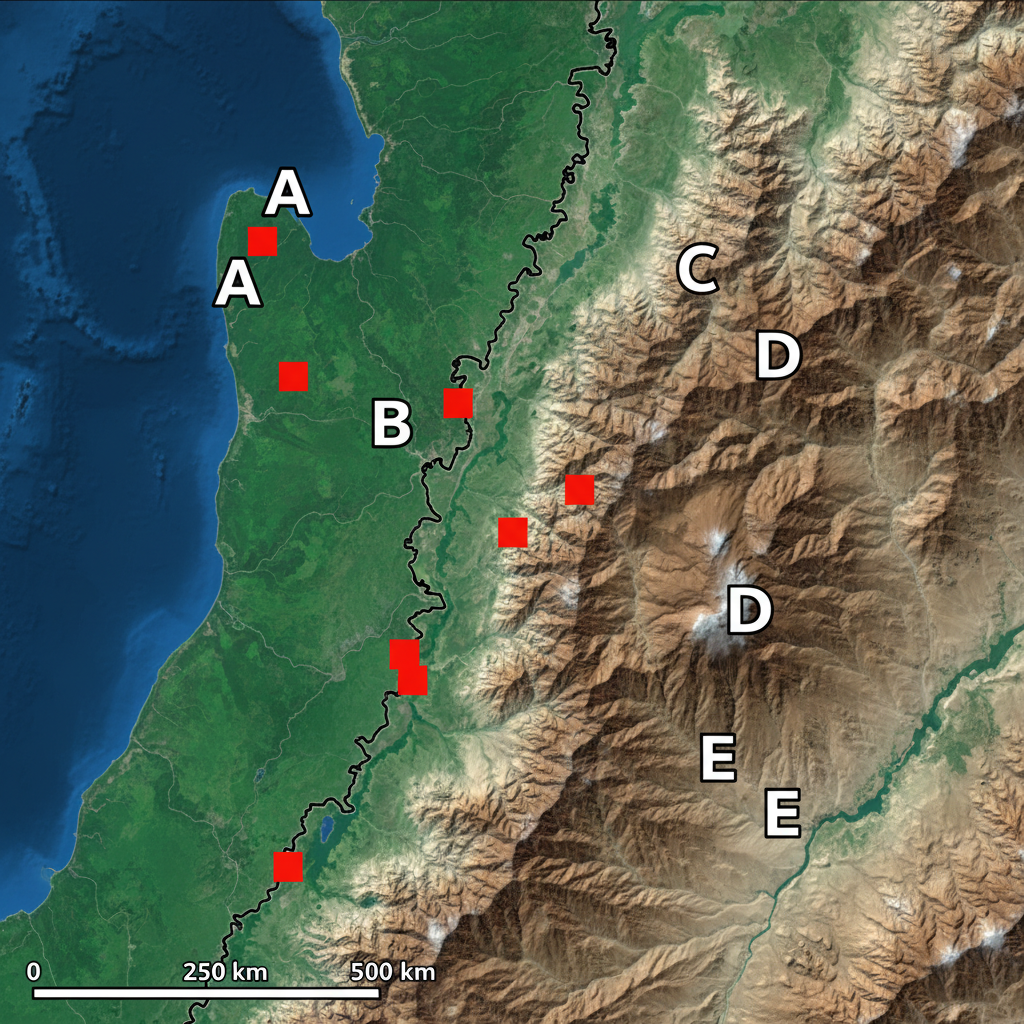
The table below shows GPS data for five locations near a plate boundary, recorded over three years.
Locations A and D are 500 km apart.
| Location | A | B | C | D | E |
|---|---|---|---|---|---|
| Direction | NW | NW | SE | SE | SE |
| Speed (mm/year) | 35 | 32 | 28 | 30 | 27 |
Locations A and D are 500 km apart.
a
Interpret the movement pattern in the table and identify the type of plate boundary. [2]
b
Calculate the expected change in distance between A and D after 10 years. Show your working. [2]
c
Analyse whether the three-year GPS record provides a reliable basis for your 10-year prediction. [3]
Solutions
That's every free question here — 4 of 71.
+67 more questions, plus Mock Papers & Worksheets, are waiting in Premium.