You're viewing free preview questions — 4 questions previewing here — subscribe to unlock 65 more, plus the Full Question Bank, Mock Papers & Worksheets.Upgrade
Renewable and Non-Renewable Resources — Free MYP3 Sciences Practice Questions

1QuestionComparing Energy Resources for SustainabilityConcept Practice
2 marks~3 minCriterion A
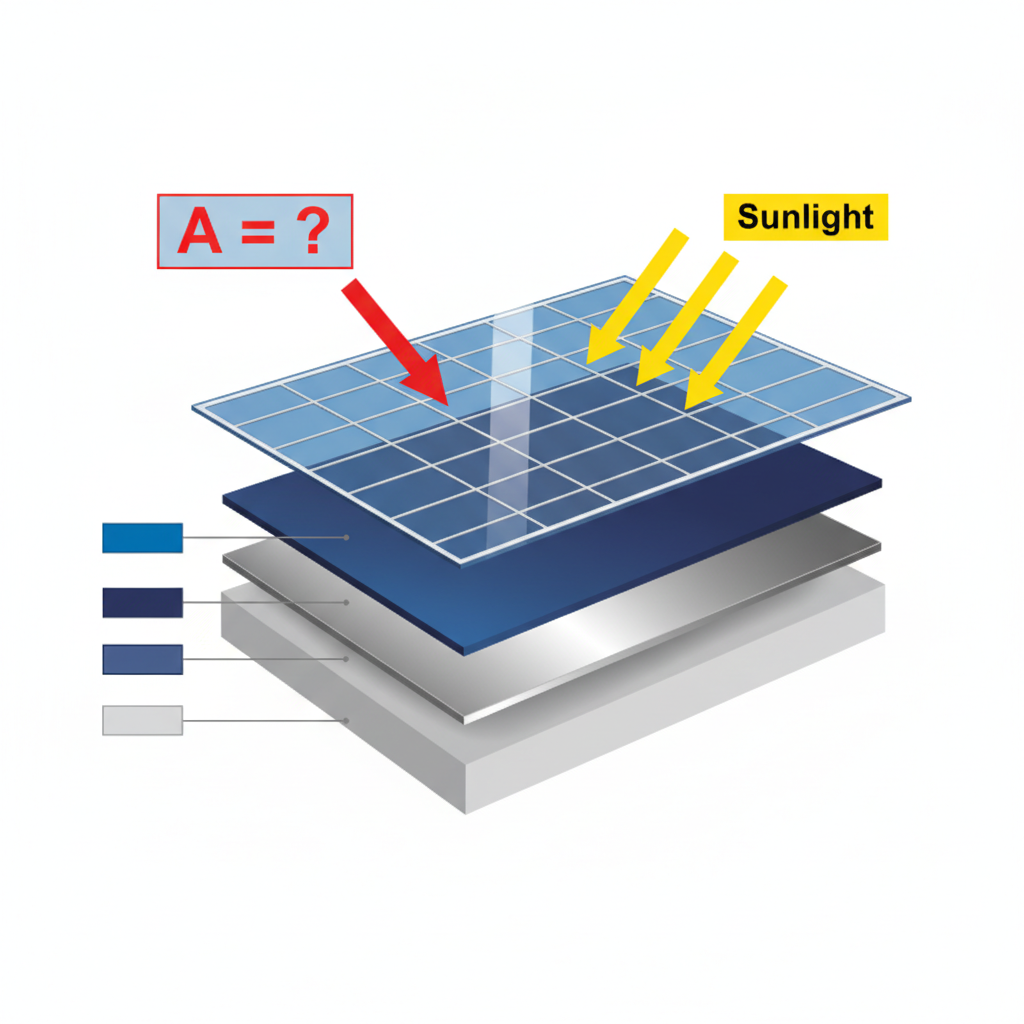
The diagram shows a simplified solar panel. Component A is one of several identical units arranged in rows across the top surface of the panel.
a
Identify component A. [1]
b
Explain why multiple units of component A are connected together in a solar panel. [1]

Solutions
2QuestionComparing Energy Resources for SustainabilityAssessment Practice
8 marks~12 minCriterion D
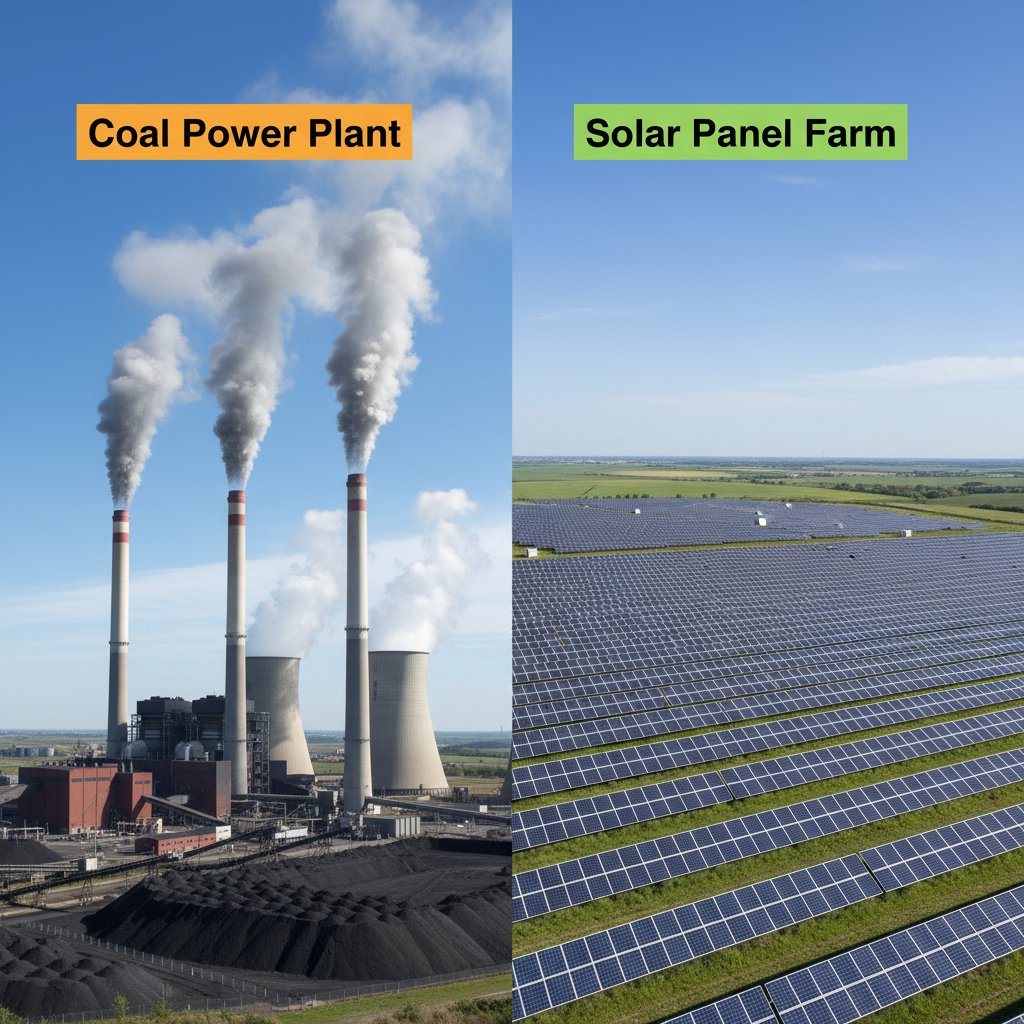
A coal-fired power plant and a solar farm each produce 500 kWh of electricity per day. The coal plant burns coal continuously; the solar farm uses 2 000 panels spread across 4 hectares of land.
a
Describe what happens chemically when coal is burned to produce electricity, and identify one harmful substance released into the atmosphere. [2]
b
Explain why the solar farm requires 4 hectares of land to match the coal plant's daily output of 500 kWh. [2]
c
A town council must choose one energy source for the next 30 years. Using the information above, analyse the environmental impacts of each source and justify which source the council should choose. [4]
Solutions
3QuestionDefinition of Non-Renewable ResourcesAssessment Practice
12 marks~18 minCriterion C
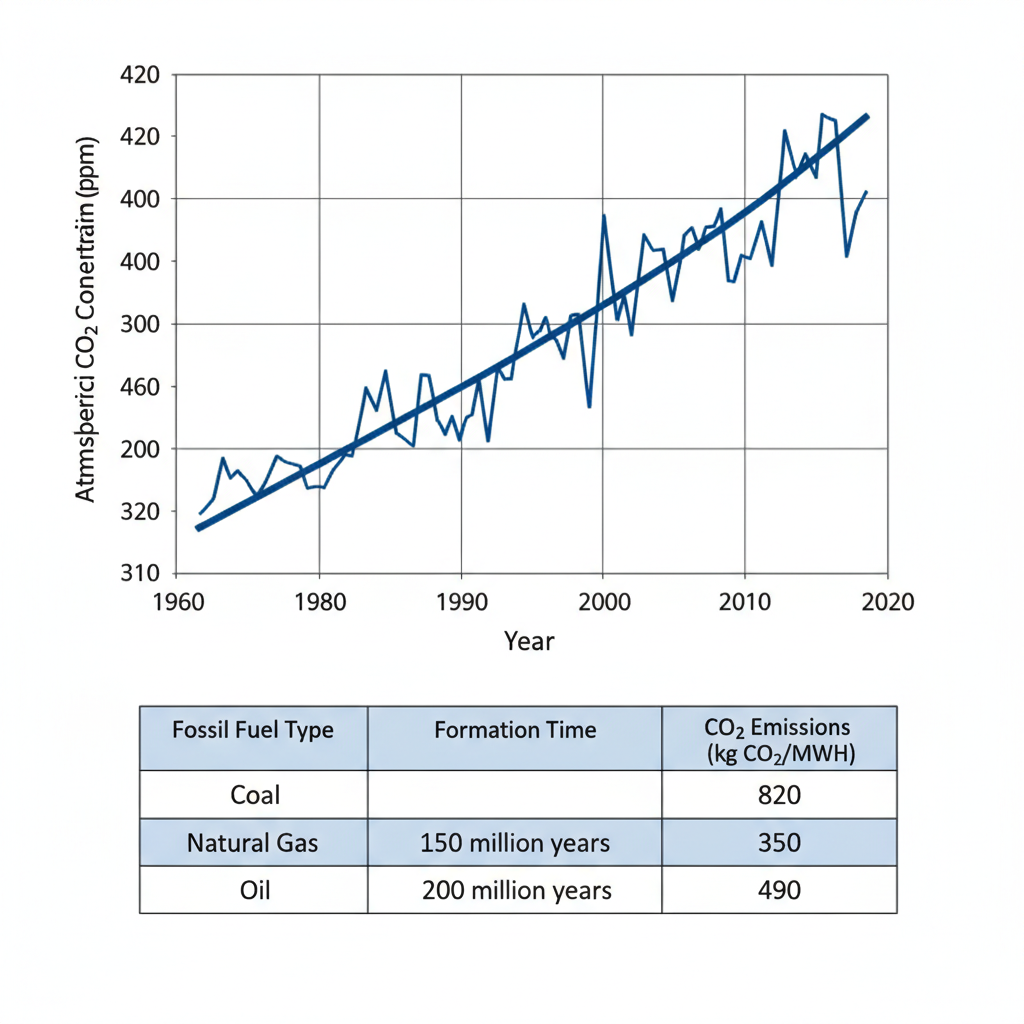
The graph below shows atmospheric CO2 concentration (in parts per million, ppm) from 1960 to 2020. The table below provides additional data.
Fossil fuel — Formation time — CO2 emitted per unit of energy (g/kWh)
Fossil fuel — Formation time — CO2 emitted per unit of energy (g/kWh)
| Coal | ~300 million years | 820 |
|---|---|---|
| Oil | ~100 million years | 650 |
| Natural gas | ~50 million years | 490 |
a
Describe the trend in atmospheric CO2 concentration shown in the graph between 1960 and 2020. [2]
b
Explain why fossil fuels are classified as non-renewable resources, using the formation time data provided. [4]
c
A country is deciding whether to replace its coal power plants with natural gas power plants. Using the data in the table, analyse whether this change would reduce CO2 emissions, and explain how continued use of either fuel contributes to the greenhouse effect. [6]
Solutions
4QuestionDefinition of Non-Renewable ResourcesAssessment Practice
12 marks~18 minCriterion B
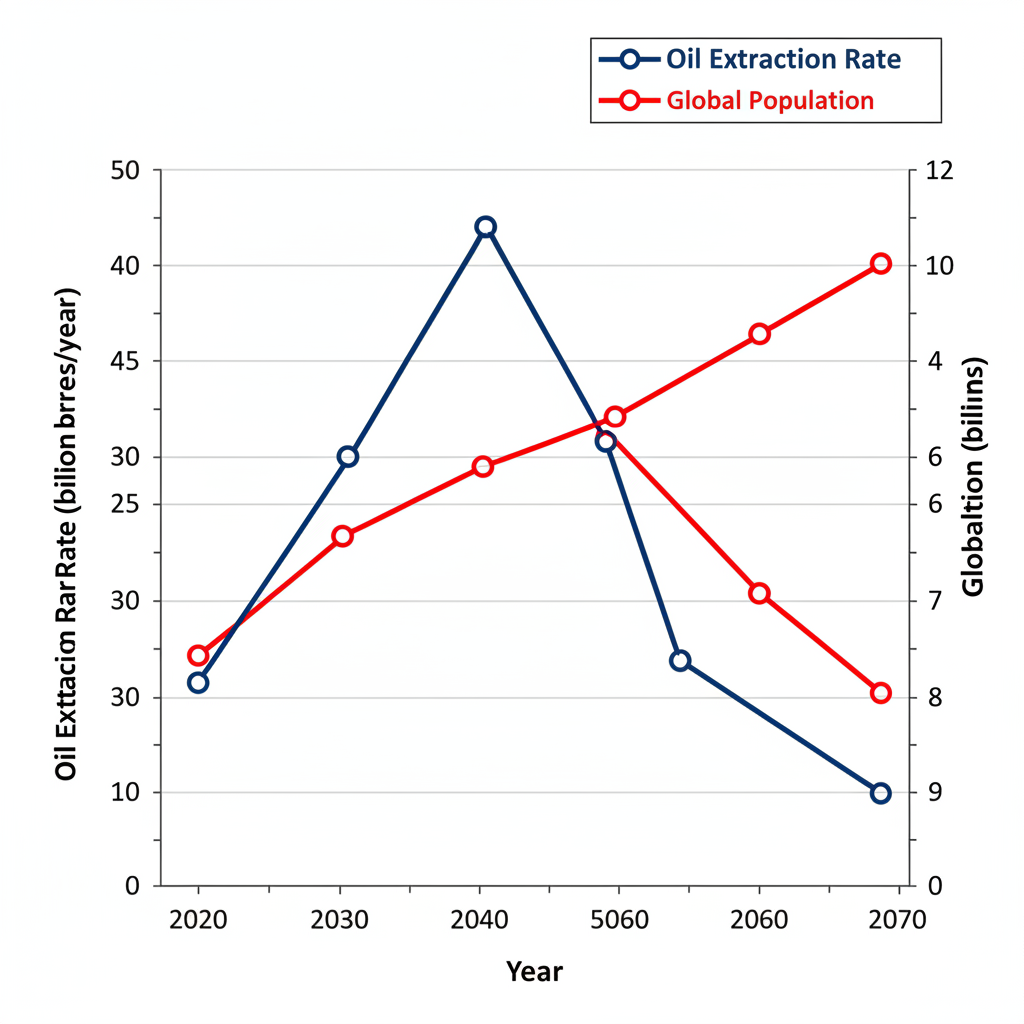
The graph shows the projected oil extraction rate (billions of barrels per year) and global population (billions of people) from 2020 to 2070. The extraction rate starts at 35 billion barrels/year in 2020, peaks at 45 billion barrels/year in 2040, then falls to 10 billion barrels/year in 2070. The population rises steadily from 7.8 billion to 9.8 billion over the same period.
a
Using the graph, identify the year in which the oil extraction rate reaches its peak, and state what happens to the extraction rate after that year. [2]
b
Explain how the definition of a non-renewable resource accounts for the decline in the oil extraction rate shown in the graph. [4]
c
Analyse two factors, not shown in the graph, that could cause the actual year when oil supply fails to meet global demand to be either earlier or later than the graph suggests. For each factor, state whether it would make the shortage happen sooner or later, and why. [6]
Solutions
That's every free question here — 4 of 69.
+65 more questions, plus Mock Papers & Worksheets, are waiting in Premium.