You're viewing free preview questions — 4 questions previewing here — subscribe to unlock 69 more, plus the Full Question Bank, Mock Papers & Worksheets.Upgrade
Motion Graphs Distance-Time — Free MYP3 Sciences Practice Questions

1QuestionDrawing Graphs from DescriptionsConcept Practice
2 marks~3 minCriterion A
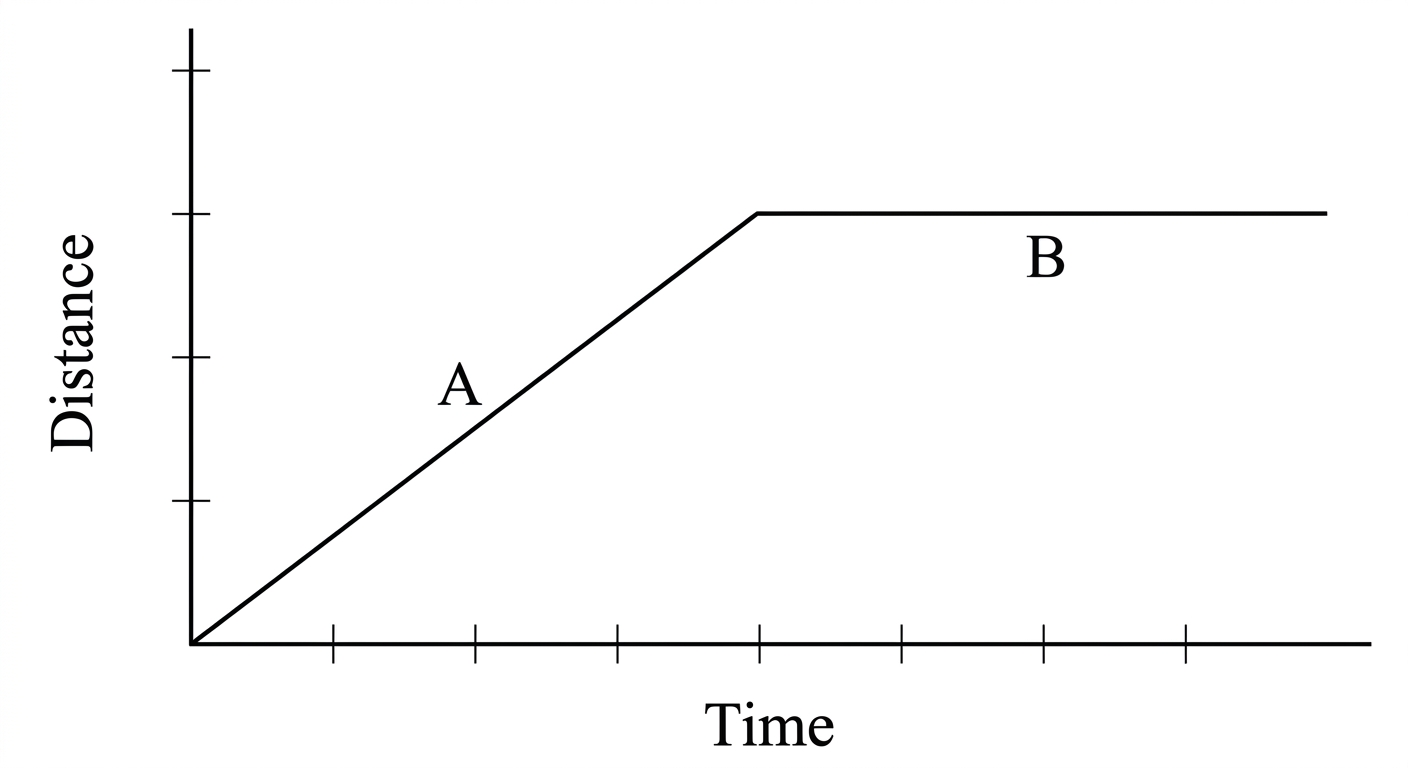
The distance-time graph below shows two sections of an object's motion.
Section A is a straight line sloping upward from left to right.
Section B is a horizontal straight line.
Section A is a straight line sloping upward from left to right.
Section B is a horizontal straight line.
a
State what Section B tells you about the motion of the object. [1]
b
Explain how the graph shows that the object was moving faster in Section A than it would be if the line were less steep. [1]

Solutions
2QuestionPlotting and Interpreting Distance-Time GraphsAssessment Practice
6 marks~9 minCriterion B
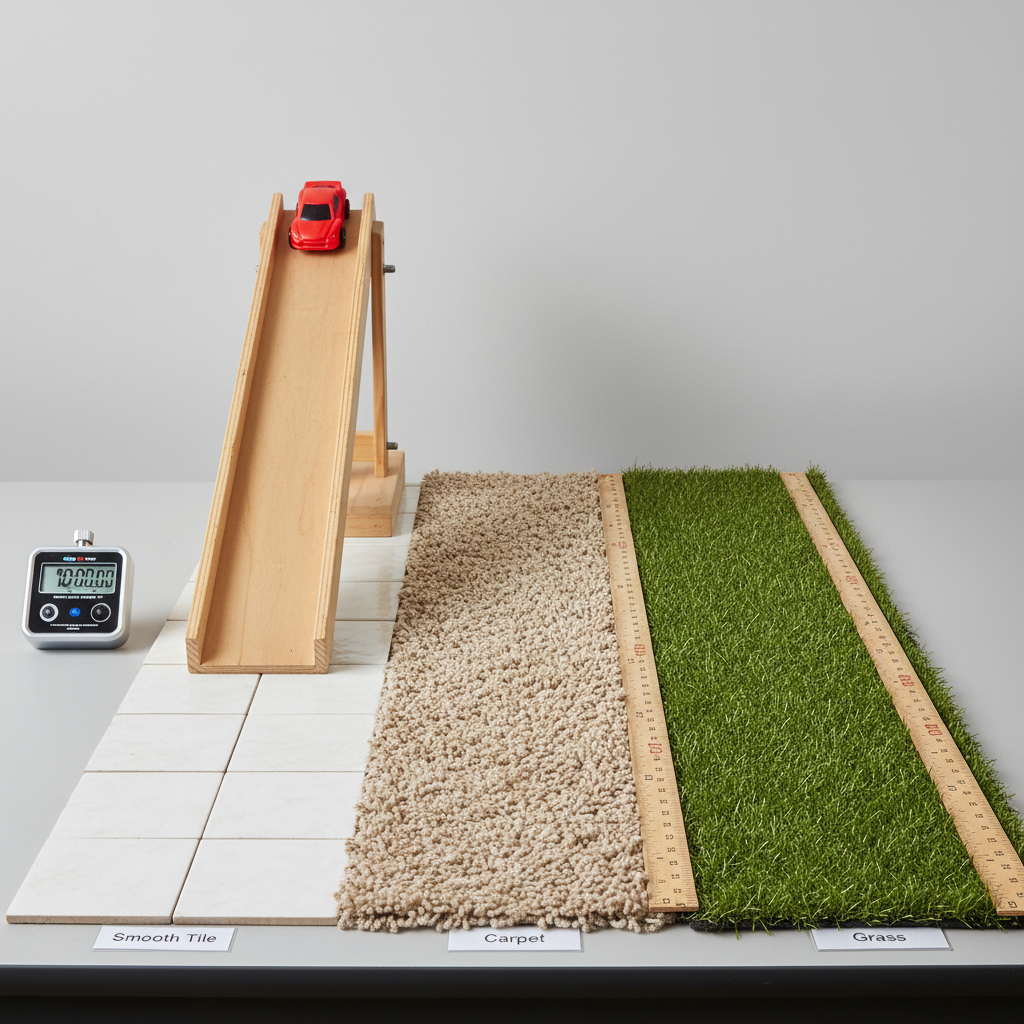
A toy car rolls from a ramp onto three horizontal surfaces. The table shows the distance travelled every 2 seconds.
| Time (s) | 0 | 2 | 4 | 6 | 8 |
|---|---|---|---|---|---|
| Smooth tile (m) | 0 | 2.0 | 4.0 | 6.0 | 8.0 |
| Carpet (m) | 0 | 1.2 | 2.4 | 3.6 | 4.8 |
| Grass (m) | 0 | 0.6 | 1.2 | 1.8 | 2.4 |
a
Calculate the speed of the car on carpet. [1]
b
Explain why the car travels more slowly on grass than on smooth tile. [2]
c
The car is tested on sandpaper, which is rougher than grass. Using the data, describe and justify the shape of the distance-time graph you would expect for sandpaper. [3]
Solutions
3QuestionMatching Graphs to Real-World ScenariosAssessment Practice
6 marks~9 minCriterion C
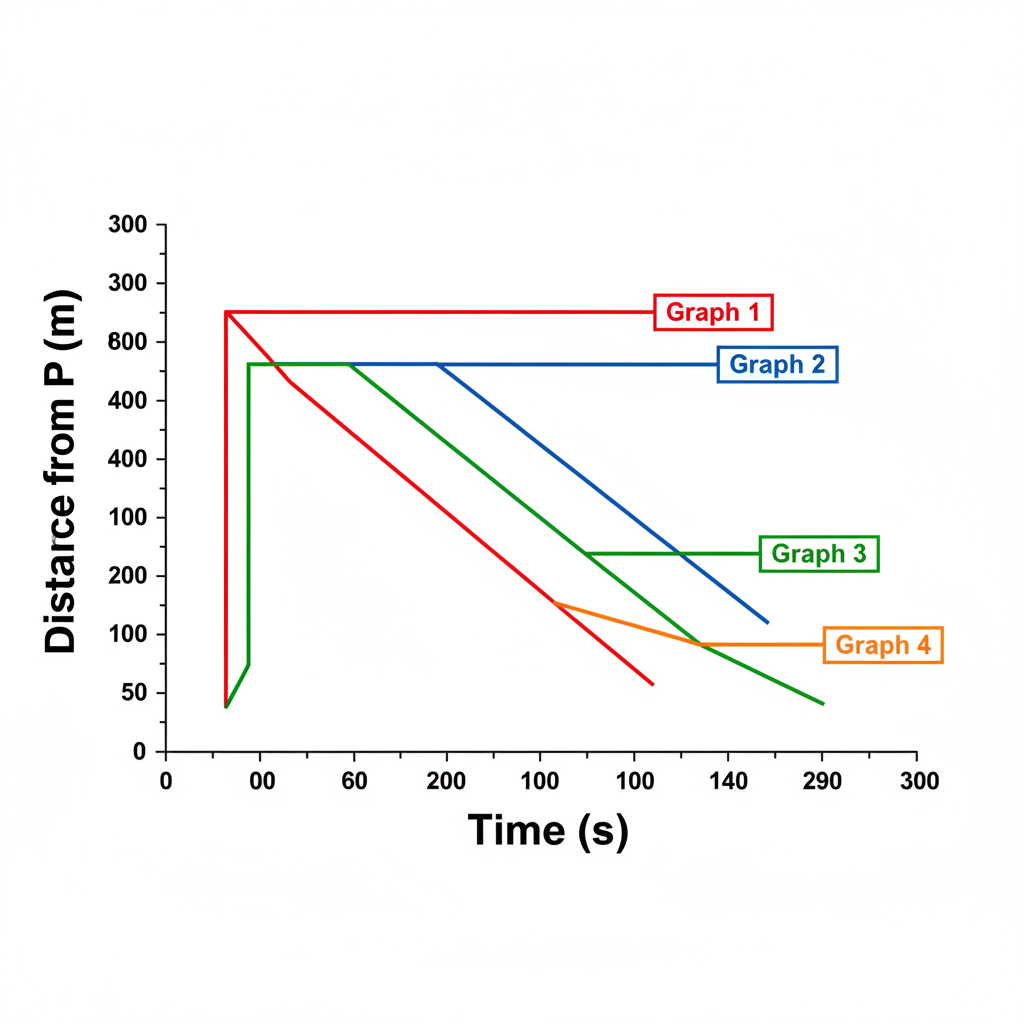
A cyclist leaves point P and rides 300 m to point Q at a constant speed of 5 m/s. She stops at Q for 30 seconds, then returns to P at 3 m/s. The vertical axis shows distance from P (m); the horizontal axis shows time (s).
a
Calculate the time taken for the return journey. [1]
b
Explain what the gradient of a distance–time graph represents, and calculate the gradient of each segment of Graph 1. [3]
c
Graph 1, Graph 2, Graph 3, and Graph 4 are described below. Identify which graph correctly represents the cyclist's motion and justify why each of the other three graphs is incorrect, using the terms gradient, speed, and stationary. [2]
Graph 1: rises from to , horizontal from to , falls to .
Graph 2: rises from to , horizontal from to , falls to .
Graph 3: rises from to , horizontal from to , falls to .
Graph 4: rises from to , falls immediately to with no horizontal segment.
Graph 1: rises from to , horizontal from to , falls to .
Graph 2: rises from to , horizontal from to , falls to .
Graph 3: rises from to , horizontal from to , falls to .
Graph 4: rises from to , falls immediately to with no horizontal segment.
Solutions
4QuestionDrawing Graphs from DescriptionsAssessment Practice
8 marks~12 minCriterion D
A bus leaves a depot from rest, accelerates steadily for 20 s to reach 10 m/s, travels at constant speed for 60 s, then decelerates steadily to a stop over 15 s. After waiting 30 s at a traffic light, it accelerates steadily for 10 s to 8 m/s, travels at constant speed for 40 s, then decelerates steadily to a stop over 10 s.
a
Calculate the distance travelled during each segment of the journey. [3]
b
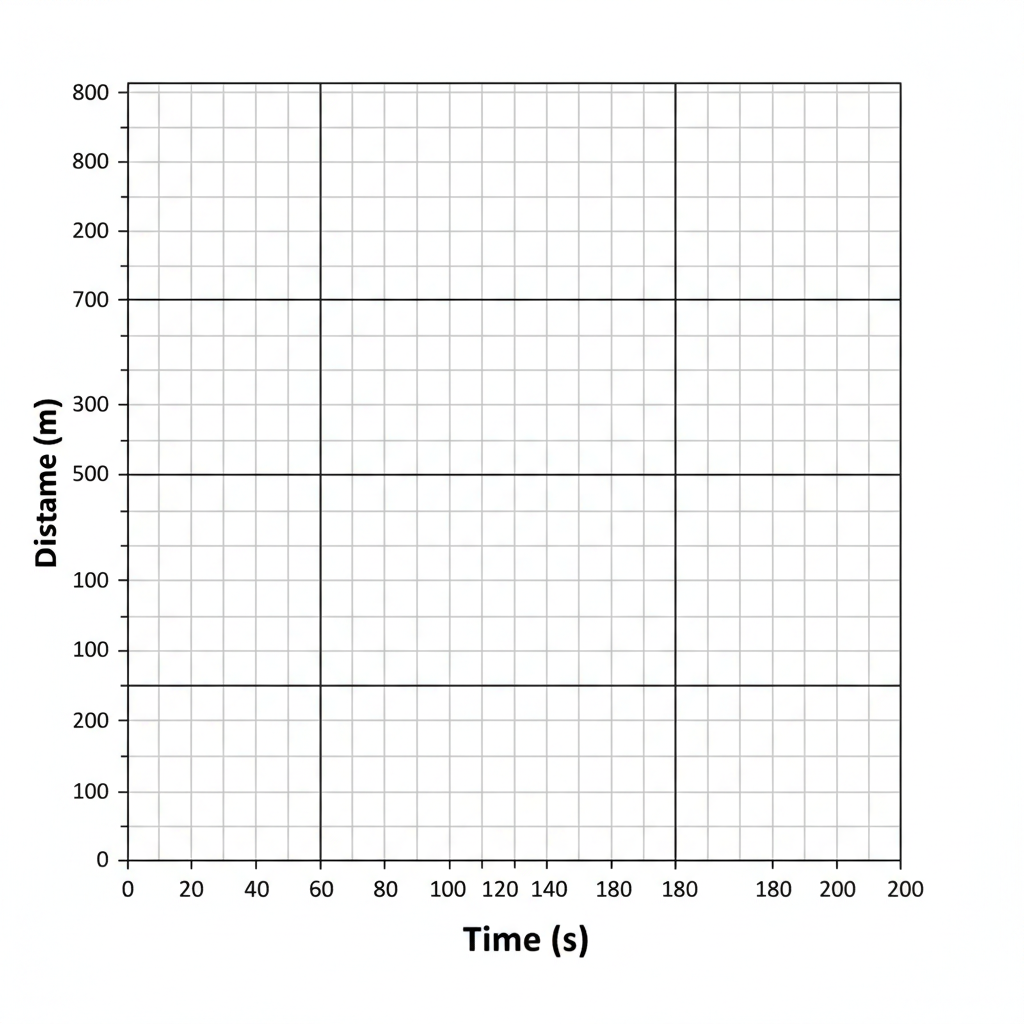
On the grid provided, draw a distance–time graph for the full journey. Label both axes with quantities and units, and mark the total time and total distance at the final stop. [3]
c
The city council uses this motion model to set the bus timetable. Explain one way in which a real journey might differ from this model and describe one consequence this difference could have for passengers. [2]
Solutions
That's every free question here — 4 of 73.
+69 more questions, plus Mock Papers & Worksheets, are waiting in Premium.