You're viewing free preview questions — 4 questions previewing here — subscribe to unlock 80 more, plus the Full Question Bank, Mock Papers & Worksheets.Upgrade
Speed Velocity and Acceleration — Free MYP3 Sciences Practice Questions

1QuestionCalculating Speed Distance TimeConcept Practice
2 marks~3 minCriterion A
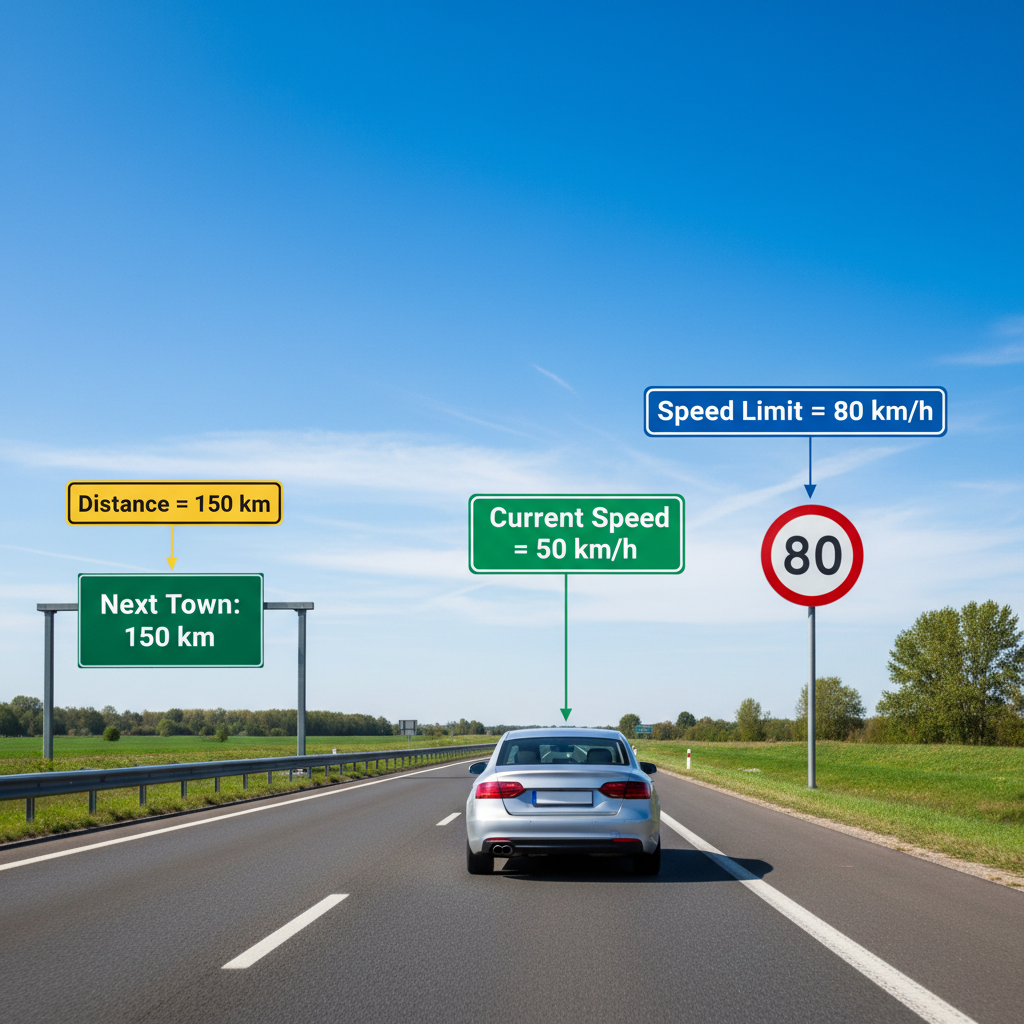
A car travels 150 km at a constant speed of 50 km/h.
a
Calculate the time taken for this journey. [1]
b
Using your answer to part (a), explain one safety reason why governments set speed limits on highways. [1]

Solutions
2QuestionCalculating Speed Distance TimeAssessment Practice
6 marks~9 minCriterion D
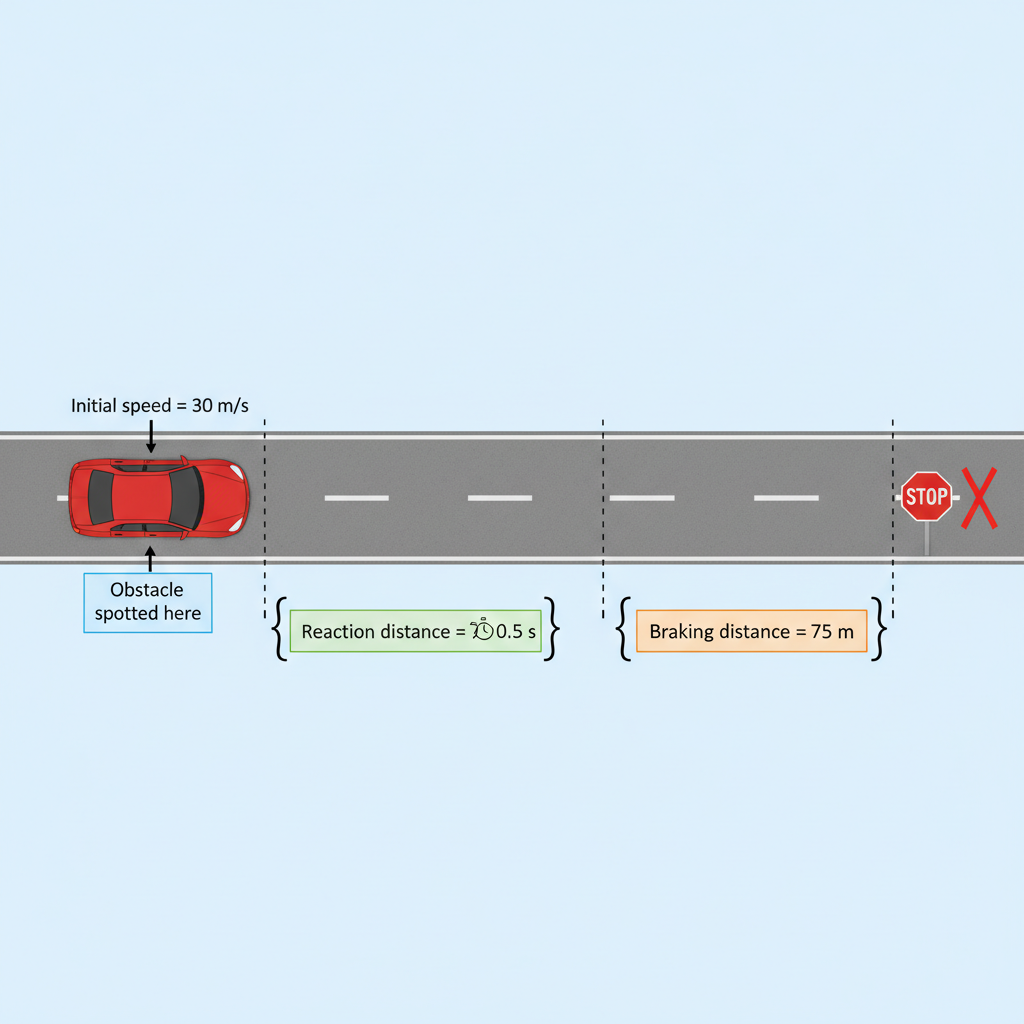
A car travels at . The driver reacts in , during which the car moves at constant speed. After the brakes are applied, the car decelerates uniformly and stops over a braking distance of .
The diagram below shows the car's motion from the moment the driver sees an obstacle until the car stops, with reaction distance and braking distance labelled.
The diagram below shows the car's motion from the moment the driver sees an obstacle until the car stops, with reaction distance and braking distance labelled.
a
Calculate the deceleration of the car during braking. [2]
b
Explain how stopping distance data can be used by engineers to set speed limits on roads. [2]
c
Identify and explain two limitations of the model used in part (a). [2]
Solutions
3QuestionDifference Between Speed and VelocityAssessment Practice
8 marks~12 minCriterion C
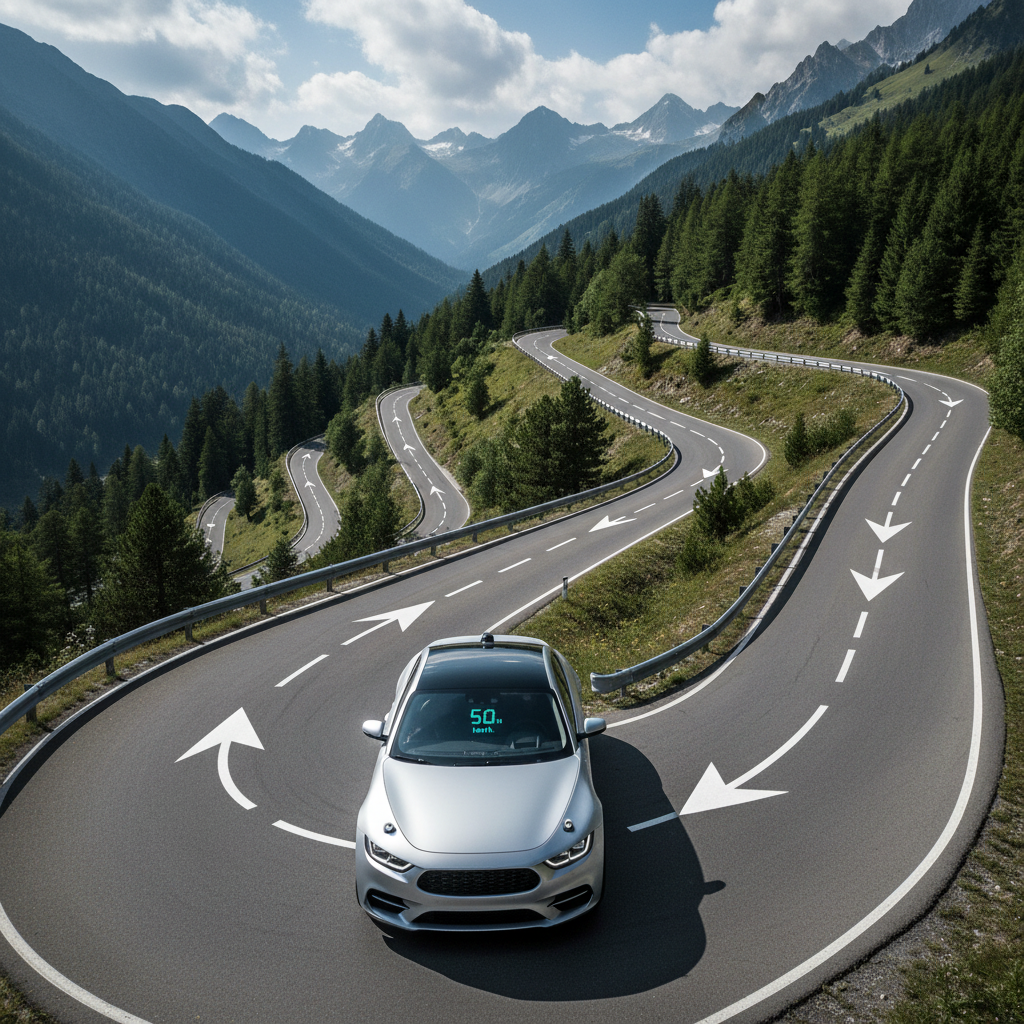
A self-driving car travels a winding mountain road at a constant speed of . The company claims the car is safer than human-driven vehicles because it "always maintains the same speed."
a
Describe the difference between speed and velocity. [2]
b
Explain why the car's velocity changes on the winding road, even though its speed stays constant. [2]
c
A passenger reads the company's claim. Analyse whether the claim is scientifically accurate, and explain one way the claim could affect public trust in the technology. [4]
Solutions
4QuestionCalculating Speed Distance TimeAssessment Practice
5 marks~8 minCriterion B
A student investigates how ramp height affects the speed of a toy car. The car is released from rest and travels 1 metre along the ramp. The time taken is measured with a stopwatch.
| Ramp height (cm) | 5 | 10 | 15 | 20 |
|---|---|---|---|---|
| Time taken (s) | 2.0 | 1.4 | 1.1 | 0.9 |
a
Calculate the speed of the car at each ramp height. Give your answers in cm/s using:
[2]
[2]
b
Describe the relationship between ramp height and the speed of the car. [1]
c
A student predicts the speed at a ramp height of 25 cm. State a reasonable predicted value and justify your prediction using the pattern in the data. [2]
Solutions
That's every free question here — 4 of 84.
+80 more questions, plus Mock Papers & Worksheets, are waiting in Premium.