You're viewing free preview questions — 5 questions previewing here — subscribe to unlock 80 more, plus the Full Question Bank, Mock Papers & Worksheets.Upgrade
Food Webs, Pyramids, and Energy Flow — Free MYP4 Biology Practice Questions

1QuestionConstructing and Analyzing Food WebsConcept Practice
3 marks~5 minCriterion A
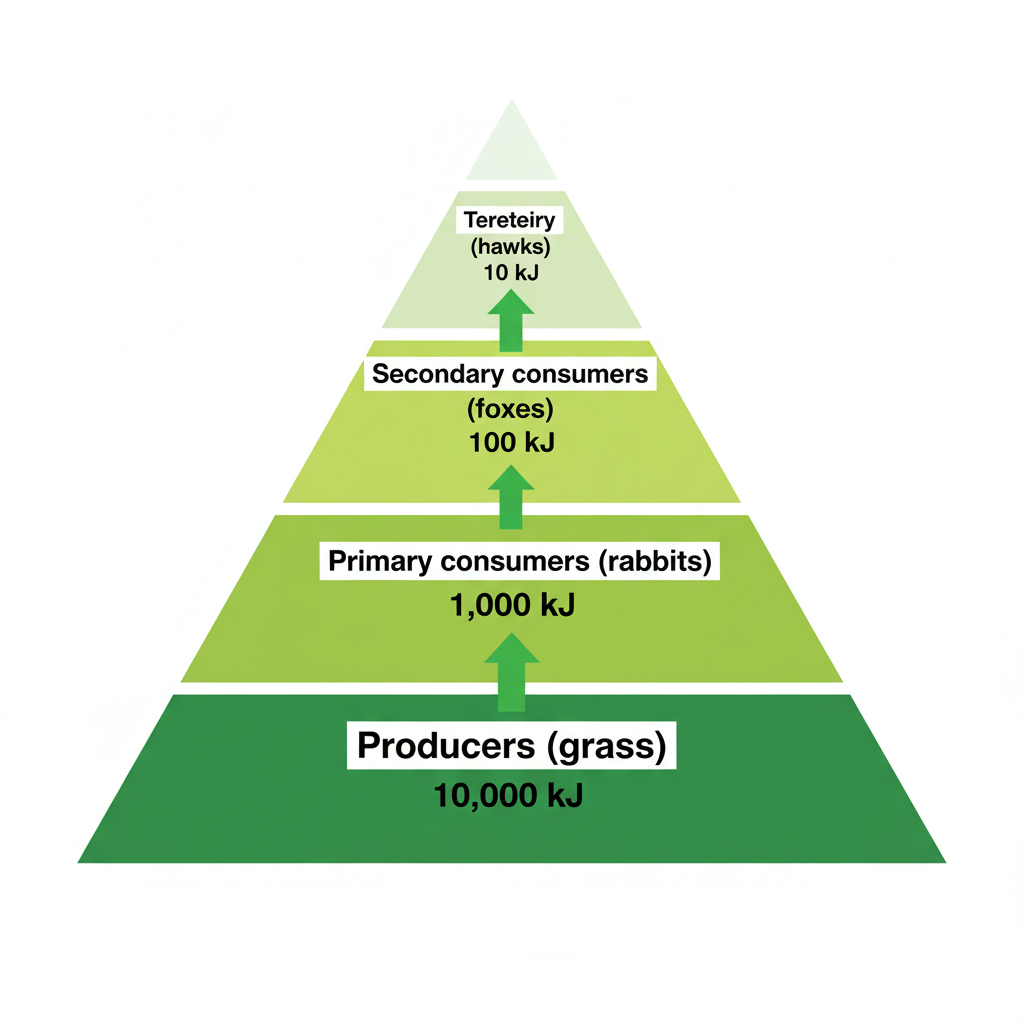
A grassland ecosystem contains the following food chain:
Grass → Rabbits → Foxes → Hawks
Energy available at each trophic level:
Foxes: 100 kJ
Hawks: 10 kJ
Grass → Rabbits → Foxes → Hawks
Energy available at each trophic level:
| Grass | 10 | 000 kJ |
|---|---|---|
| Rabbits | 1 | 000 kJ |
Foxes: 100 kJ
Hawks: 10 kJ
a
State one reason why energy is lost between trophic levels. [1]
b
Using the data above, calculate the percentage of energy transferred from rabbits to foxes. Show your working. [1]
c
Explain why the pattern of energy transfer shown in this food chain means that food chains rarely exceed four or five trophic levels. [1]

Solutions
2QuestionEnergy Loss at Each Trophic LevelAssessment Practice
4 marks~6 minCriterion A
A grassland ecosystem contains the following food chain with measured biomass values:
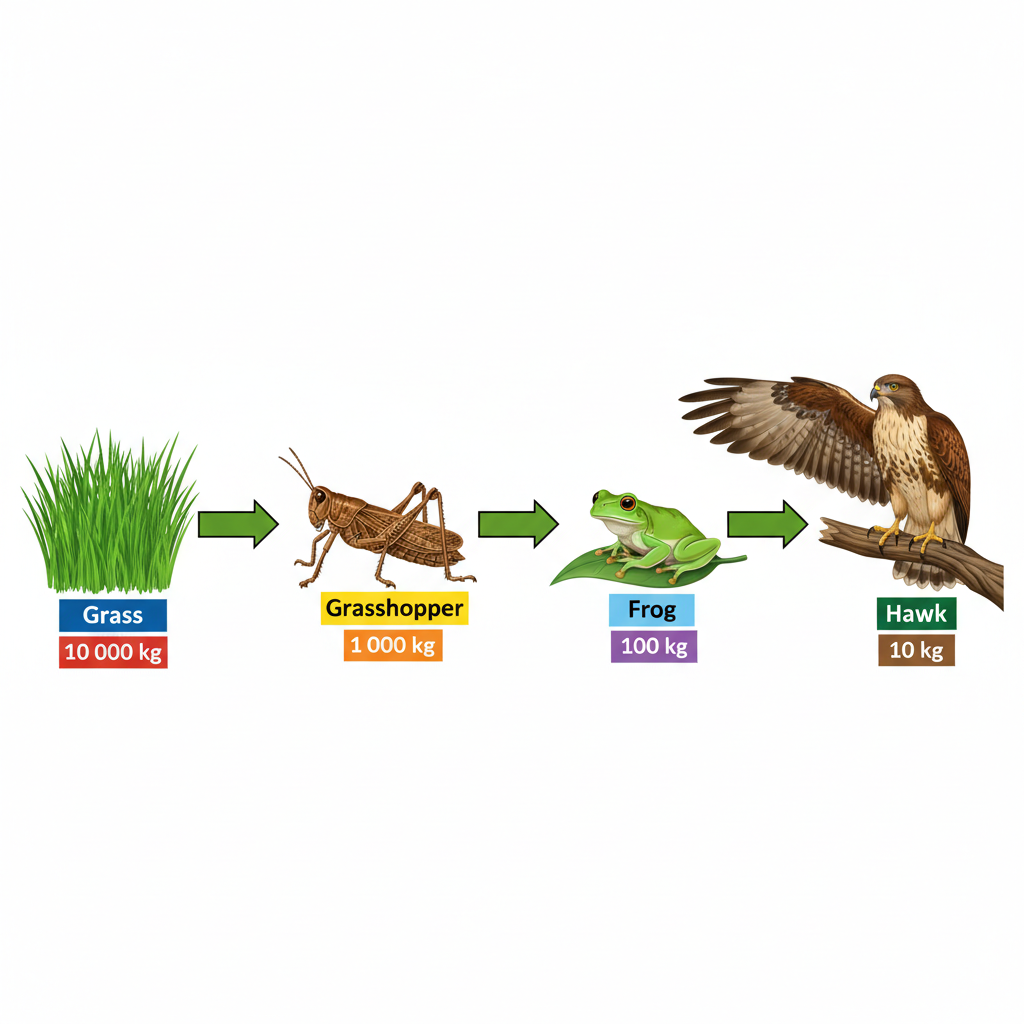
Grass → Grasshopper → Frog → Hawk
Biomass at each trophic level:
Frog: 100 kg
Hawk: 10 kg
Grass → Grasshopper → Frog → Hawk
Biomass at each trophic level:
| Grass | 10 | 000 kg |
|---|---|---|
| Grasshopper | 1 | 000 kg |
Frog: 100 kg
Hawk: 10 kg
a
Calculate the percentage of biomass transferred from grass to grasshopper, and from grasshopper to frog. [2]
b
Explain why only approximately 10% of biomass is transferred between trophic levels, referring to specific processes by which energy is lost. [1]
c
The hawk population in this ecosystem declines sharply due to disease. Analyse how this change would affect biomass distribution across the remaining trophic levels. [1]
Solutions
3QuestionDisruption of Food WebsAssessment Practice
5 marks~8 minCriterion C
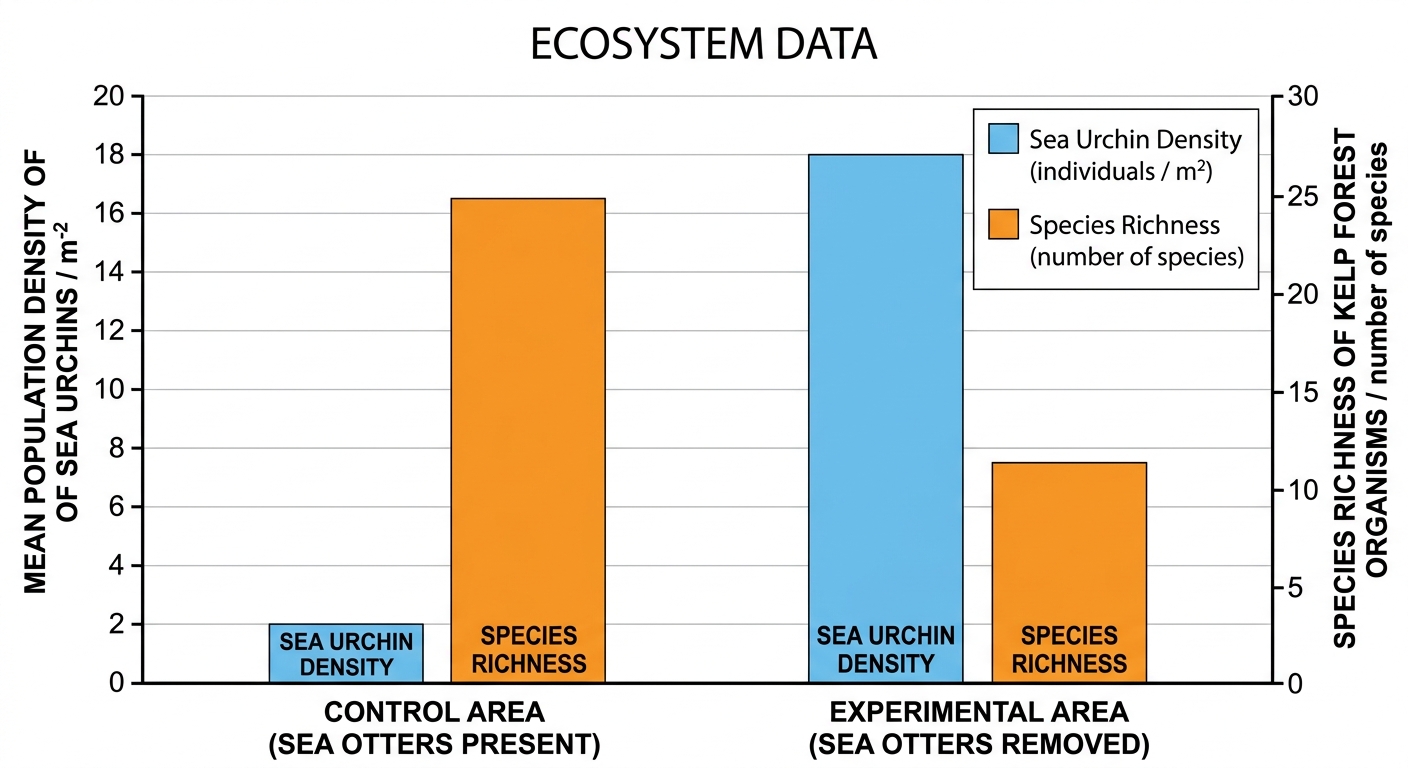
In a coastal ecosystem, researchers tested whether sea otters act as a keystone species controlling sea urchin populations. Two fenced areas were established: a control area (otters present) and an experimental area (otters removed). After two years, the following data were recorded:
Control area: sea urchin density ; species richness species
Experimental area: sea urchin density ; species richness species
Control area: sea urchin density ; species richness species
Experimental area: sea urchin density ; species richness species
a
Define the term keystone species. [1]
b
Analyse the data to explain how the removal of sea otters affected species richness in the kelp forest. [2]
c
Evaluate whether the experimental evidence supports the hypothesis that sea otters are a keystone species, identifying two limitations of the experimental design that affect the strength of this conclusion. [2]
Solutions
4QuestionBioaccumulation and ToxinsAssessment Practice
8 marks~12 minCriterion D
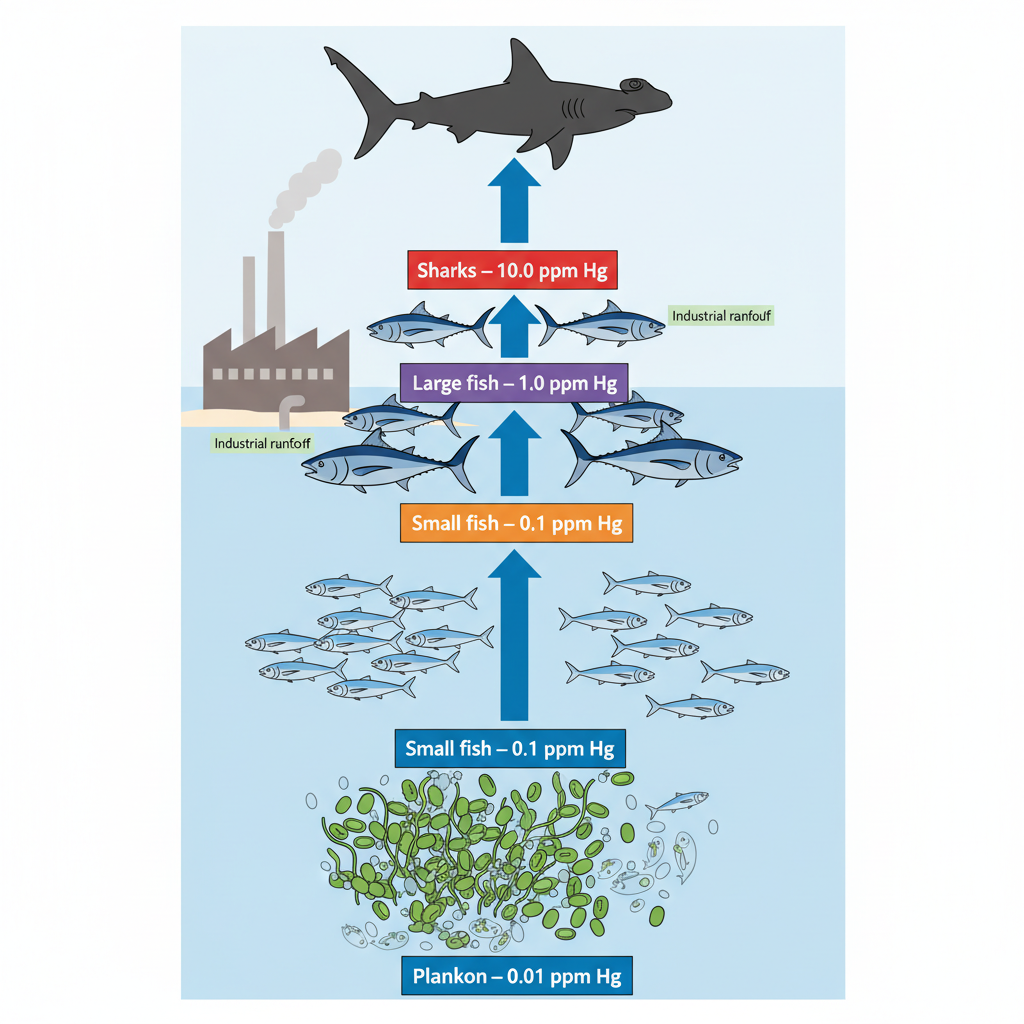
A coastal community depends on fishing for food and income. Industrial runoff has introduced mercury, a persistent toxin, into the local bay. Mercury concentrations measured across the food chain are:
Plankton: ppm
Small fish: ppm
Large fish: ppm
Sharks: ppm
The community harvests large fish and sharks as traditional food and for export.
Plankton: ppm
Small fish: ppm
Large fish: ppm
Sharks: ppm
The community harvests large fish and sharks as traditional food and for export.
a
Describe the pattern of mercury concentration across the four trophic levels and explain one direct consequence for shark populations. [2]
b
Analyse the impacts of mercury contamination on the local economy and public health. [3]
c
Evaluate the limitations of this food chain model for predicting the real-world spread of mercury in the bay. [3]
Solutions
5QuestionConstructing and Analyzing Food WebsAssessment Practice
8 marks~12 minCriterion D
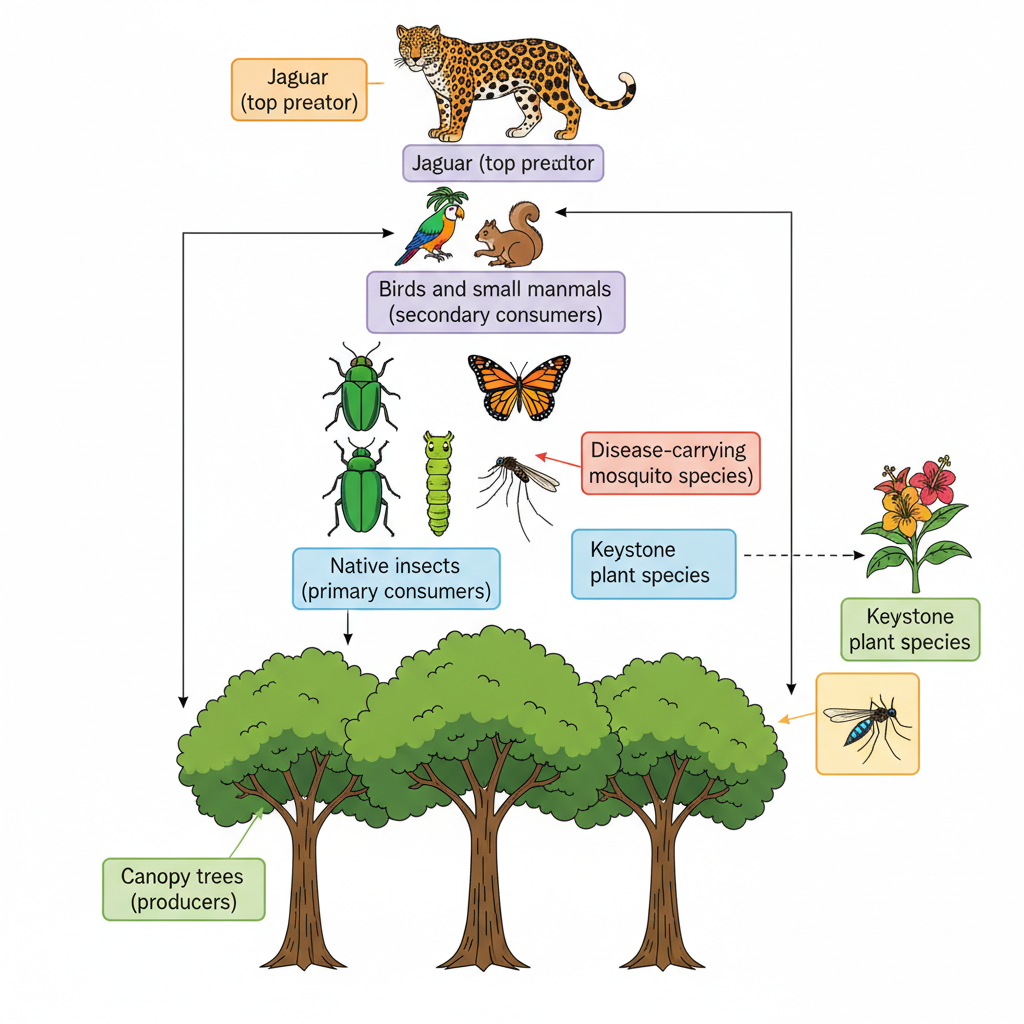
A biotechnology company proposes releasing a genetically modified (GM) mosquito into a tropical rainforest ecosystem. The GM mosquito suppresses a disease-carrying mosquito species but also competes with native insects for nectar from a keystone plant species — a primary food source for several native insect populations. The food web includes: keystone plants (producers) → native insects (primary consumers) → birds and small mammals (secondary consumers) → jaguar (apex predator).
a
Identify two feeding relationships in the food web that would be directly disrupted by the GM mosquito's competition for nectar. [2]
b
Explain how the disruption of native insect populations could trigger a trophic cascade affecting the jaguar population. [3]
c
Evaluate the reliability of laboratory-based risk assessments for predicting the long-term ecological effects of releasing the GM mosquito into the rainforest. [3]
Solutions
That's every free question here — 5 of 85.
+80 more questions, plus Mock Papers & Worksheets, are waiting in Premium.