You're viewing free preview questions — 4 questions previewing here — subscribe to unlock 78 more, plus the Full Question Bank, Mock Papers & Worksheets.Upgrade
Changes of state and energy transfer — Free MYP4 Chemistry Practice Questions

1QuestionInterpreting heating and cooling graphsConcept Practice
3 marks~5 minCriterion A
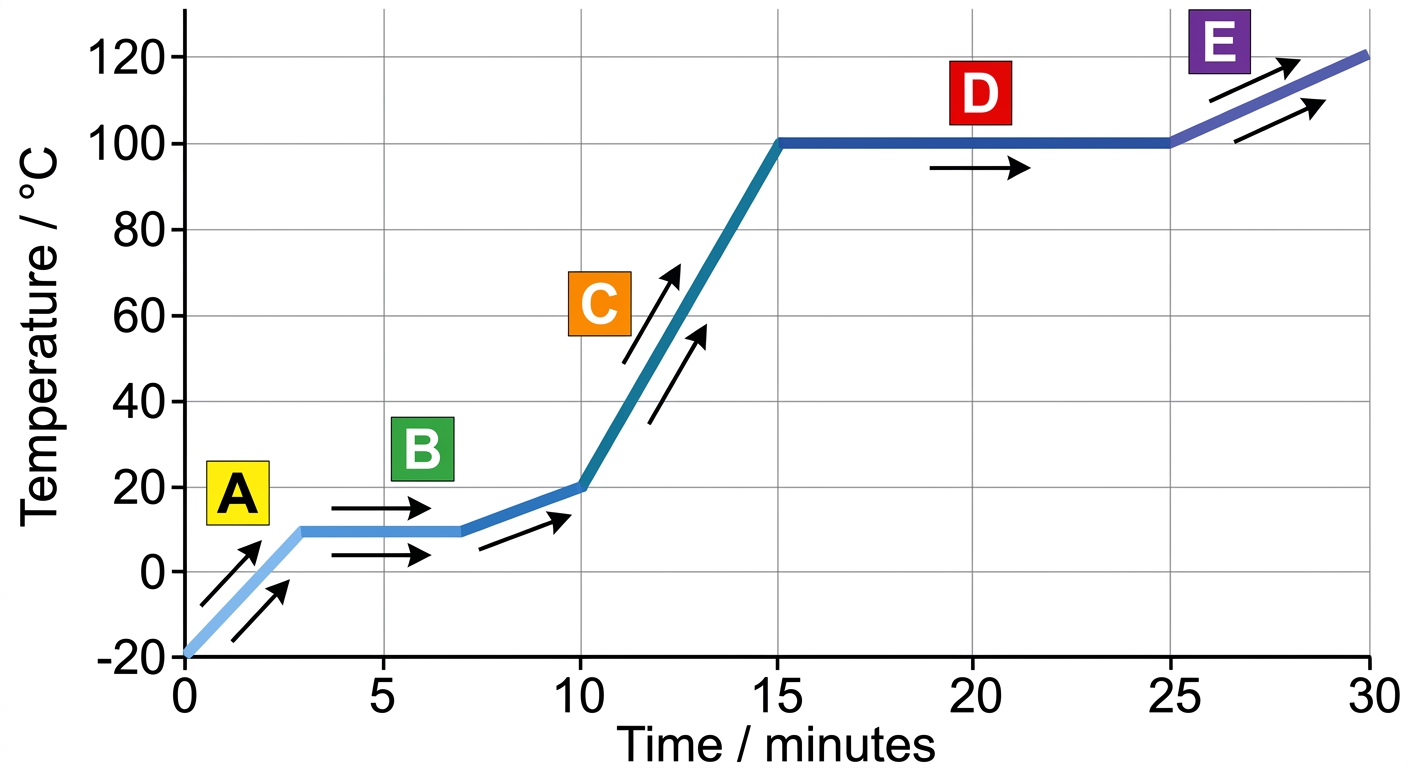
The heating curve for water shows temperature (vertical axis) against time (horizontal axis). Five segments are labelled: A (solid ice warming), B (melting at ), C (liquid water warming), D (boiling at ), and E (steam warming).
a
Identify which segment represents the melting point of water. [1]
b
Explain why temperature remains constant during segment B, even though heat is continuously supplied. In your answer, refer to particle behaviour and how the energy is used. [2]

Solutions
2QuestionConstant temperature during phase changesAssessment Practice
6 marks~9 minCriterion D
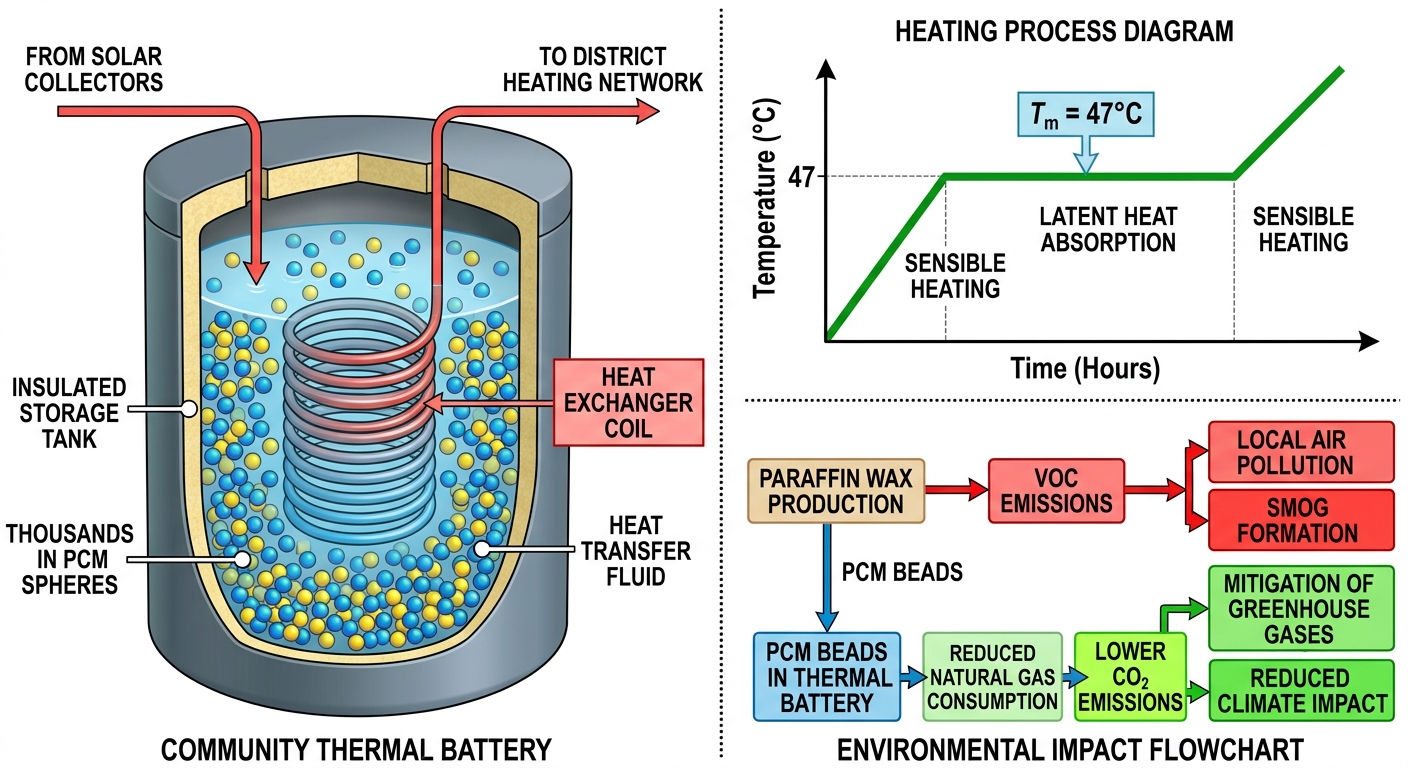
A community thermal battery uses paraffin wax as a phase-change material (PCM) to store solar heat. The wax melts at a constant temperature of during the day, storing energy, and solidifies at night, releasing heat to replace natural gas for domestic heating. Paraffin wax is petroleum-derived; its production releases volatile organic compounds (VOCs) into the local atmosphere.
a
Explain why the temperature remains constant at while the paraffin wax is melting. [2]
b
Analyse the environmental trade-off between reduced natural gas combustion and VOC emissions from paraffin wax production. [2]
c
Evaluate whether the constant-temperature assumption for the PCM remains valid in a real thermal battery, considering heat-exchanger inefficiencies and impurities in the wax. [2]
Solutions
3QuestionEnergy transfer during state changes (heating/cooling curves)Assessment Practice
6 marks~9 minCriterion C
Data
| Substance | Melting point () | Boiling point () |
|---|---|---|
| Water | 0 | 100 |
| Ethanol | −114 | 78 |
| Mercury | −39 | 357 |
| Methane | −182 | −164 |
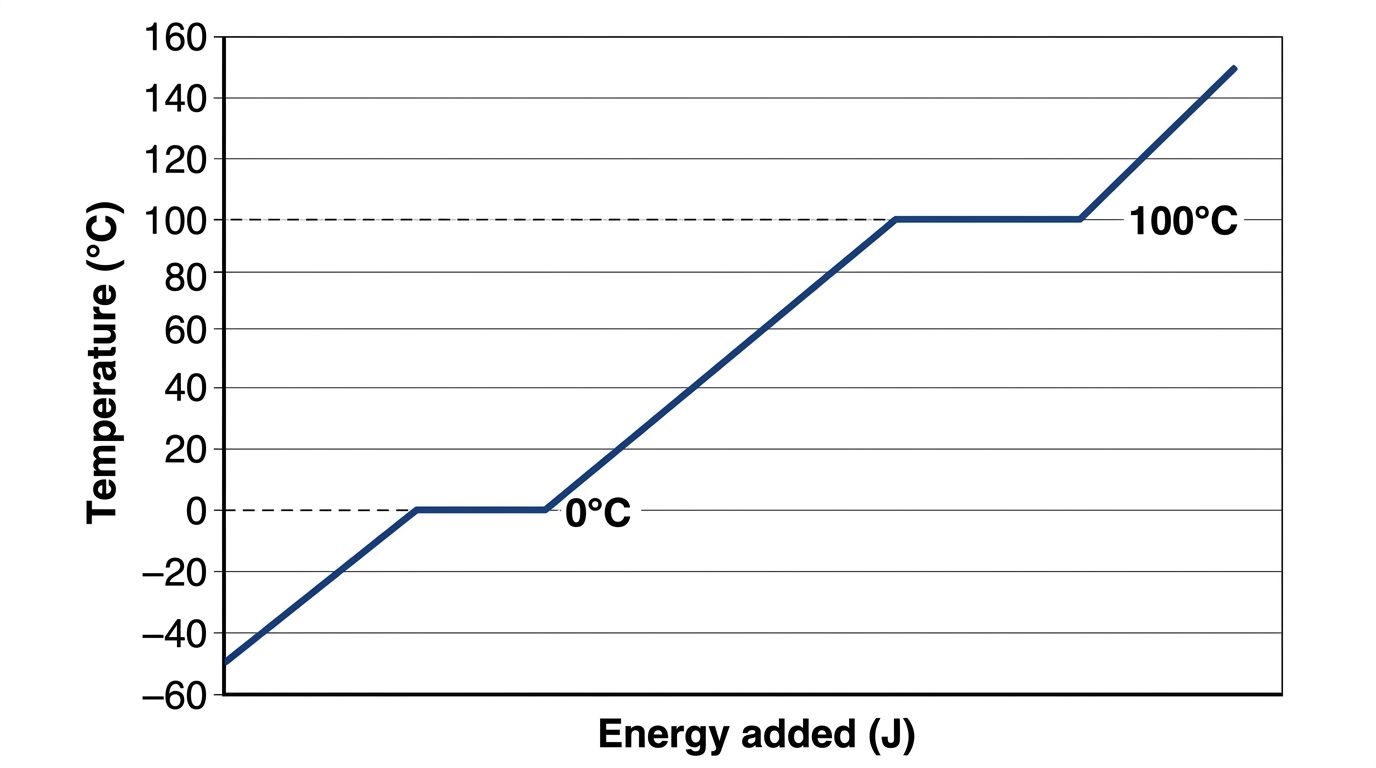
A heating curve shows the temperature of an unknown substance rising from (solid) to (gas), with two plateaus: one at and one at .
Reference
Reference
a
Deduce the identity of the unknown substance, using the plateau temperatures and the reference data to support your answer. [2]
b
Explain the changes in kinetic energy and potential energy of the particles during the segment of the heating curve between the two plateaus. [2]
c
A second heating curve shows plateaus at and . Analyse whether this substance would exist as a solid, liquid, or gas at room temperature (), and evaluate what this implies about the strength of its intermolecular forces compared with water. [2]
Solutions
4QuestionEnergy transfer during state changes (heating/cooling curves)Assessment Practice
5 marks~8 minCriterion B
A group of students heats separate 10 g samples of stearic acid from to at three different rates, recording temperature every 30 seconds.
| Heating rate () | 0.5 | 1.0 | 2.0 |
|---|---|---|---|
| Plateau duration (min) | 8.0 | 4.0 | 2.0 |
a
Deduce the relationship between heating rate and plateau duration. [1]
b
Justify a prediction for the plateau duration at a heating rate of . [2]
c
Analyse how the fixed latent heat of fusion of stearic acid accounts for the plateau durations observed at different heating rates. [2]
Solutions
That's every free question here — 4 of 82.
+78 more questions, plus Mock Papers & Worksheets, are waiting in Premium.