You're viewing free preview questions — 4 questions previewing here — subscribe to unlock 64 more, plus the Full Question Bank, Mock Papers & Worksheets.Upgrade
Energy Profiles and Bond Theory — Free MYP4 Chemistry Practice Questions

1QuestionEnergy profile diagrams (reactants → products)Concept Practice
2 marks~3 minCriterion A
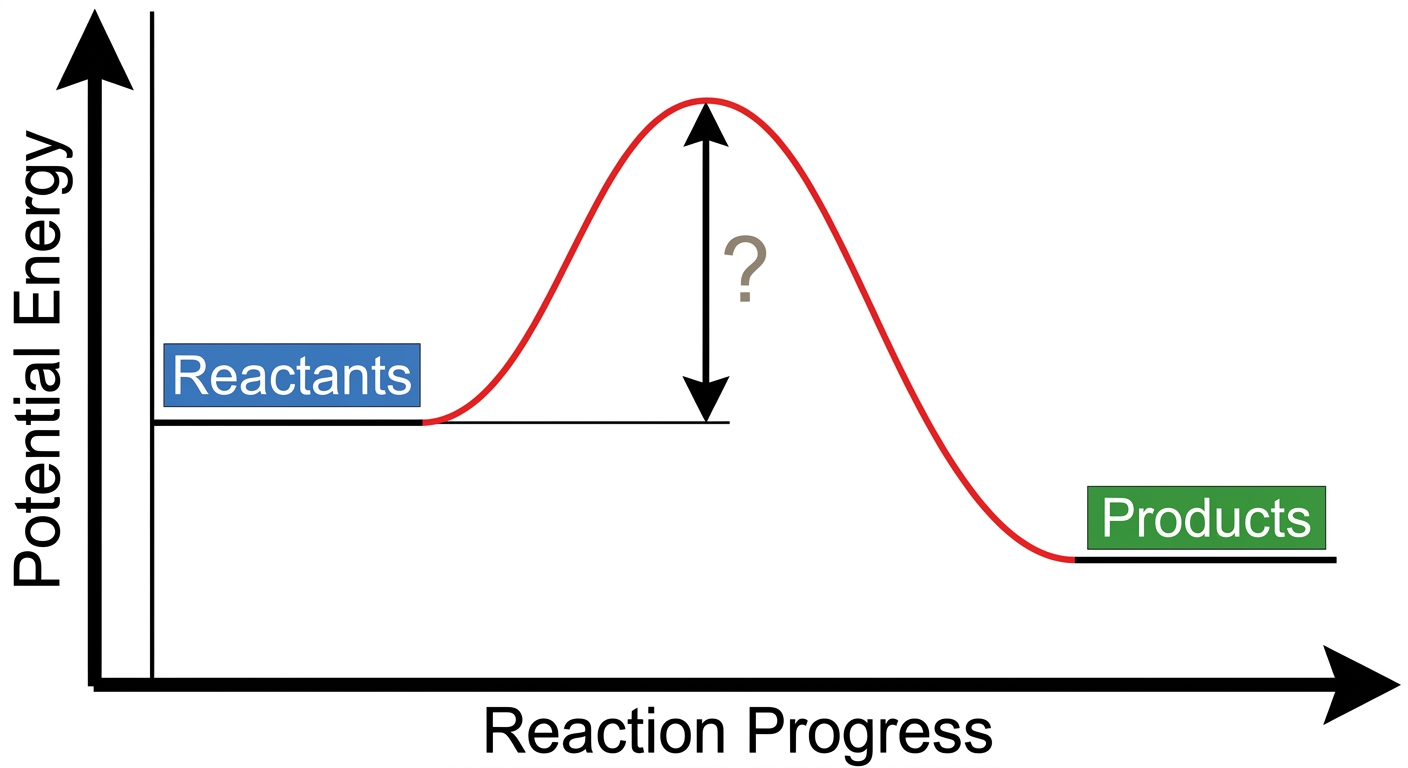
The energy profile diagram below shows a chemical reaction. The vertical axis represents potential energy and the horizontal axis represents progress of the reaction. A curved line rises from the reactants on the left to a peak, then falls to the products on the right. An arrow is drawn vertically from the reactants' energy level to the peak of the curve.
a
Identify what the arrow in the diagram represents. [1]
b
Explain why this quantity is essential for the forward reaction to occur. [1]

Solutions
2QuestionInterpreting energy diagrams (peaks, energy levels)Assessment Practice
3 marks~5 minCriterion C
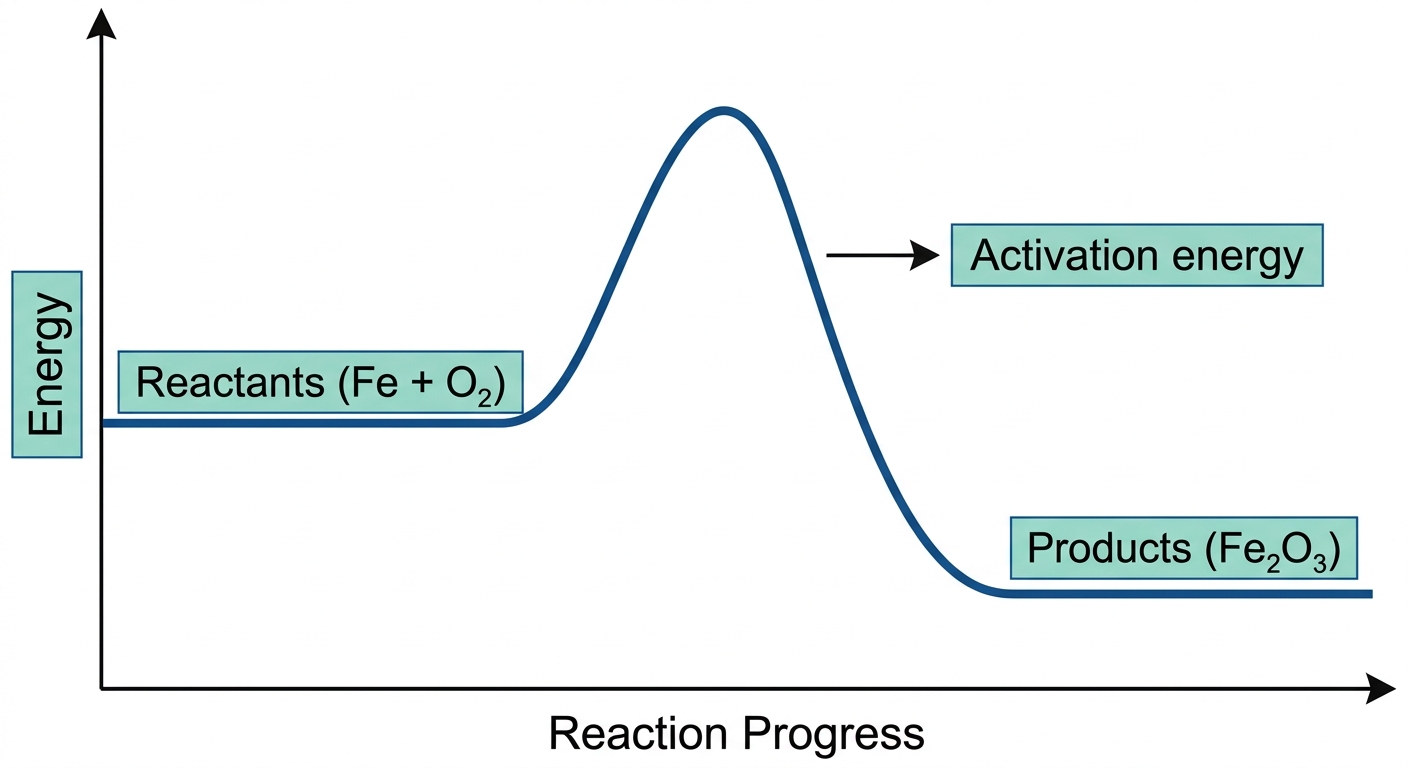
Disposable hand warmers use the oxidation of iron: . The energy profile for this reaction is shown below.
a
Interpret the energy profile to explain why the hand warmer releases heat to the user's hands. [2]
b
A student claims that used hand warmers can simply be thrown in general waste without environmental consequence. Evaluate this claim, referring to one specific environmental impact of disposal. [1]
Solutions
3QuestionEnergy profile diagrams (reactants → products)Assessment Practice
5 marks~8 minCriterion D
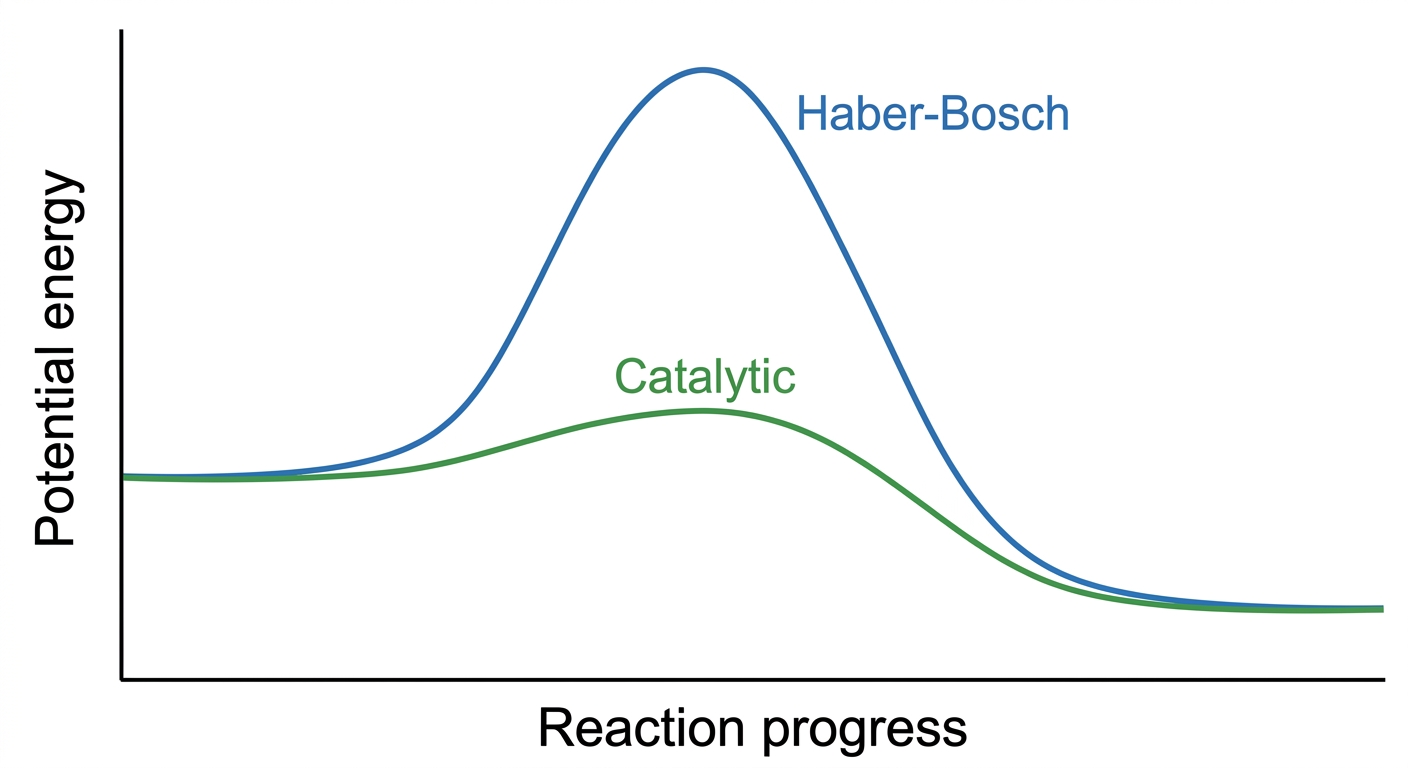
The Haber-Bosch process synthesises ammonia at 400–500°C and 200 atm, consuming large quantities of fossil fuel energy. A low-temperature alternative operates at 150°C and 10 atm using a toxic catalyst. The energy profile diagram shows two curves (A: Haber-Bosch; B: catalytic) starting at the same reactant energy level and ending at the same product energy level, with Curve A reaching a significantly higher peak than Curve B.
a
On the energy profile diagram, label the activation energy for each process. [1]
b
Analyse how the energy profiles of the two processes account for the difference in their environmental carbon footprints. [2]
c
Evaluate the trade-offs between the environmental benefit and the health and safety risks introduced by using the toxic catalyst in the low-temperature process. [2]
Solutions
4QuestionActivation energy and overall energy change (ΔH – qualitative)Assessment Practice
3 marks~5 minCriterion B
The table below shows activation energy () and overall energy change () for four reactions.
| Reaction | (kJ mol) | (kJ mol) |
|---|---|---|
| Combustion of methane | 265 | −890 |
| Decomposition of hydrogen peroxide | 75 | −98 |
| Rusting of iron | 165 | −1640 |
| Photosynthesis | light-driven | +2800 |
a
Deduce the relationship between and whether a reaction is exothermic or endothermic, using the data to support your answer. [1]
b
Explain how the relative energy levels of reactants and products differ between exothermic and endothermic reactions. [1]
c
Photosynthesis has a positive yet requires light rather than a conventional activation energy. Analyse what this suggests about the role of in determining the energy stored in the products of a reaction. [1]
Solutions
That's every free question here — 4 of 68.
+64 more questions, plus Mock Papers & Worksheets, are waiting in Premium.