You're viewing free preview questions — 5 questions previewing here — subscribe to unlock 97 more, plus the Full Question Bank, Mock Papers & Worksheets.Upgrade
Digestive and Excretory Systems — Free MYP5 Biology Practice Questions

1QuestionAccessory organsConcept Practice
2 marks~3 minCriterion A
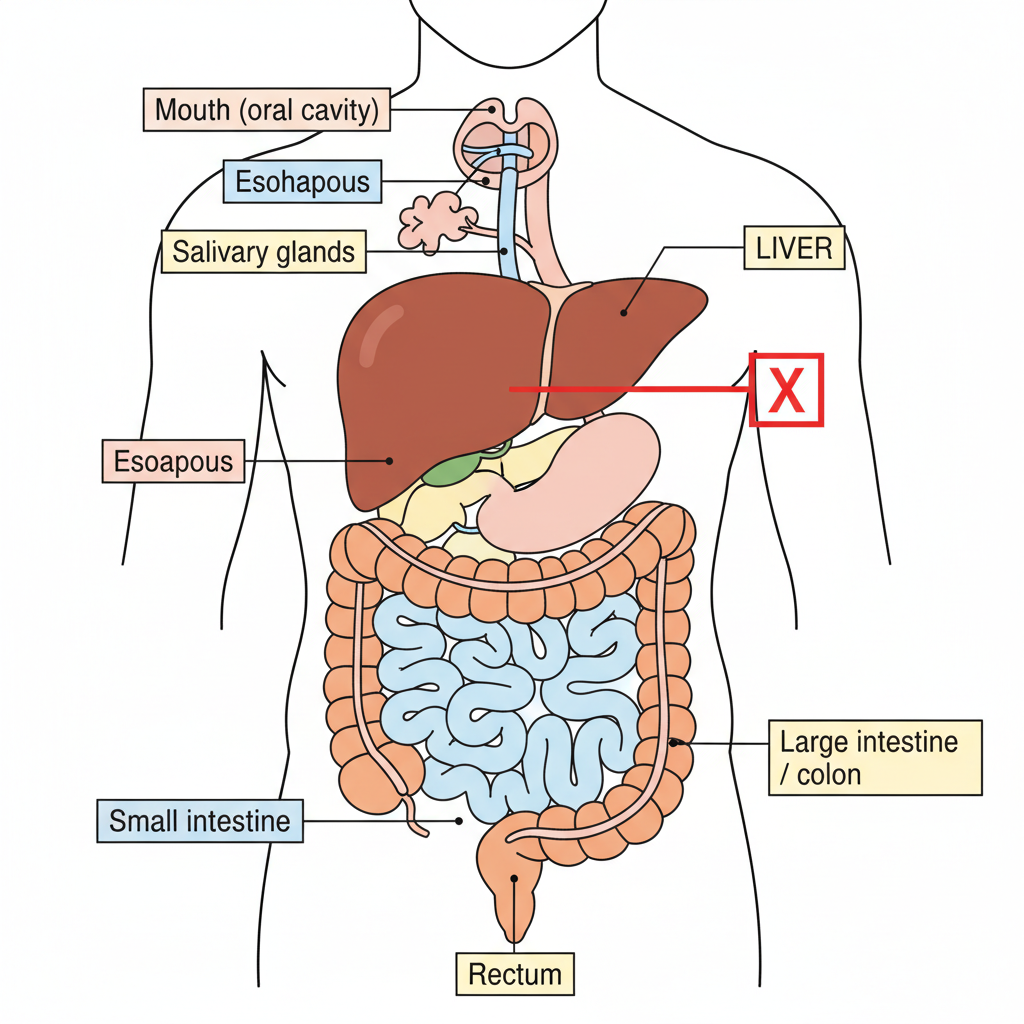
The diagram below shows the human digestive system with three organs labelled X, Y, and Z.
a
Identify the accessory organ labelled X in the diagram. [1]
b
Explain one reason why the liver is classified as an accessory organ of digestion rather than a primary digestive organ. [1]

Solutions
2QuestionAbsorption in the Small Intestine and VilliAssessment Practice
2 marks~3 minCriterion A
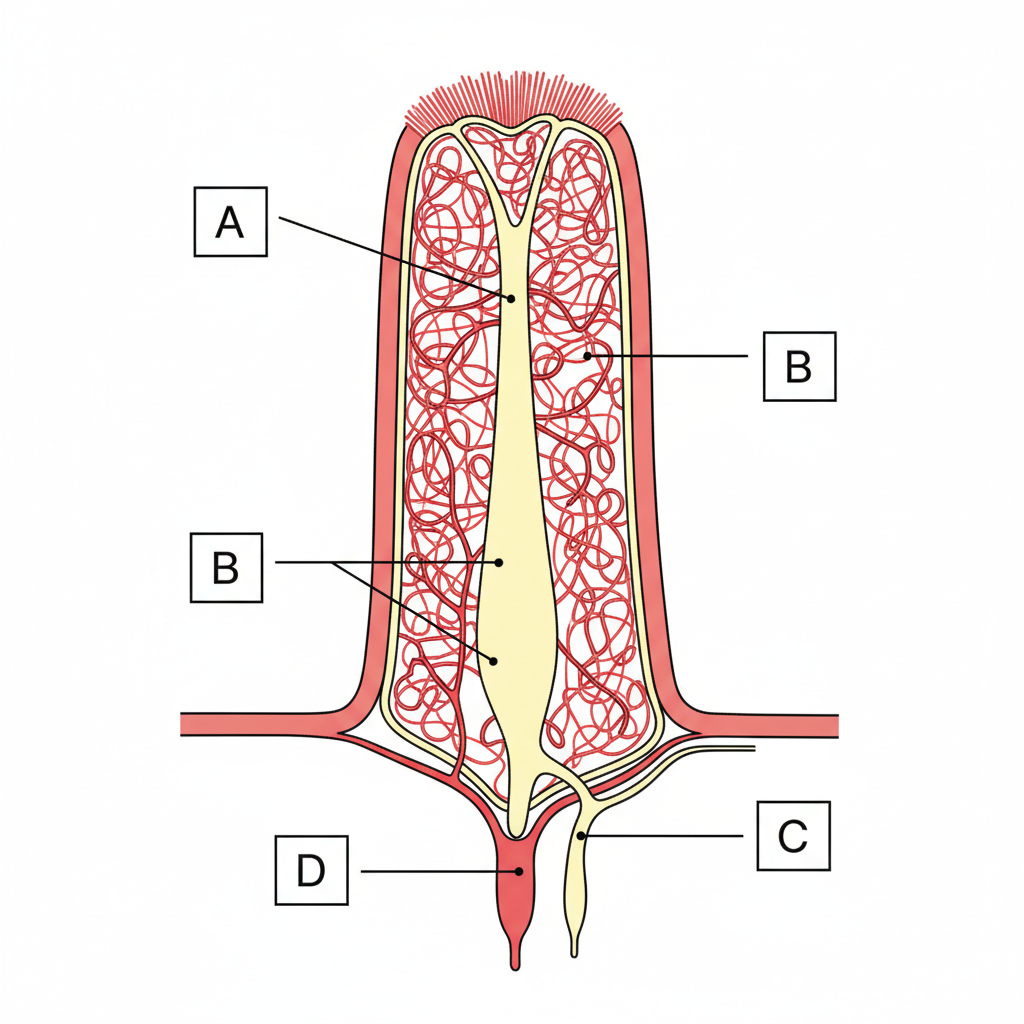
The diagram shows a cross-section of a villus from the small intestine. Structures A, B, C, and D are labelled.
a
Identify structure C. [1]
b
Explain why fatty acids and glycerol enter structure C rather than the blood capillaries found in the same villus. [1]
Solutions
3QuestionAbsorption in the Small Intestine and VilliAssessment Practice
2 marks~3 minCriterion D
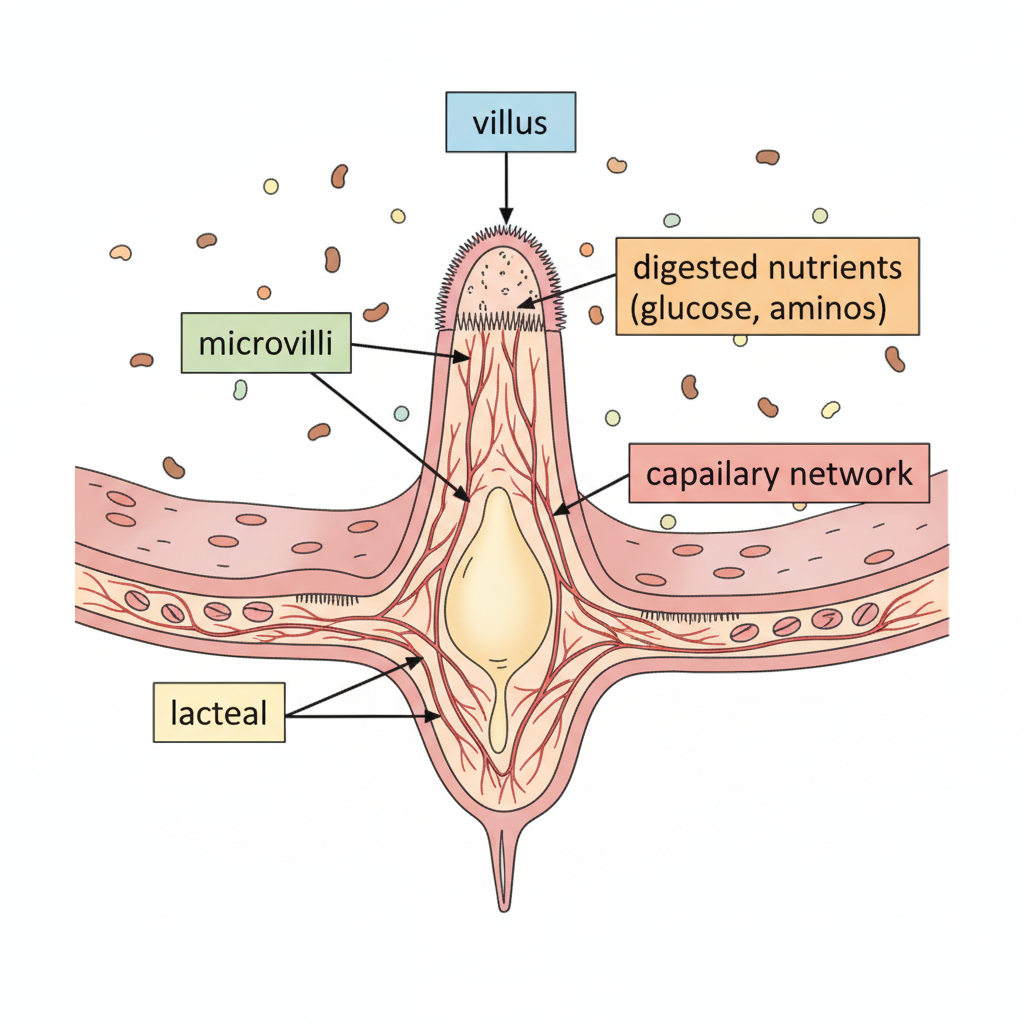
In coeliac disease, the immune system responds to gluten by damaging the lining of the small intestine, leading to a condition called villous atrophy.
Discuss how the structure and function of villi relate to both the diagnosis of coeliac disease and the ethical responsibility of hospitals to provide appropriate nutrition for affected patients. [2]
Discuss how the structure and function of villi relate to both the diagnosis of coeliac disease and the ethical responsibility of hospitals to provide appropriate nutrition for affected patients. [2]
Solutions
4QuestionAbsorption in the Small Intestine and VilliAssessment Practice
5 marks~8 minCriterion C
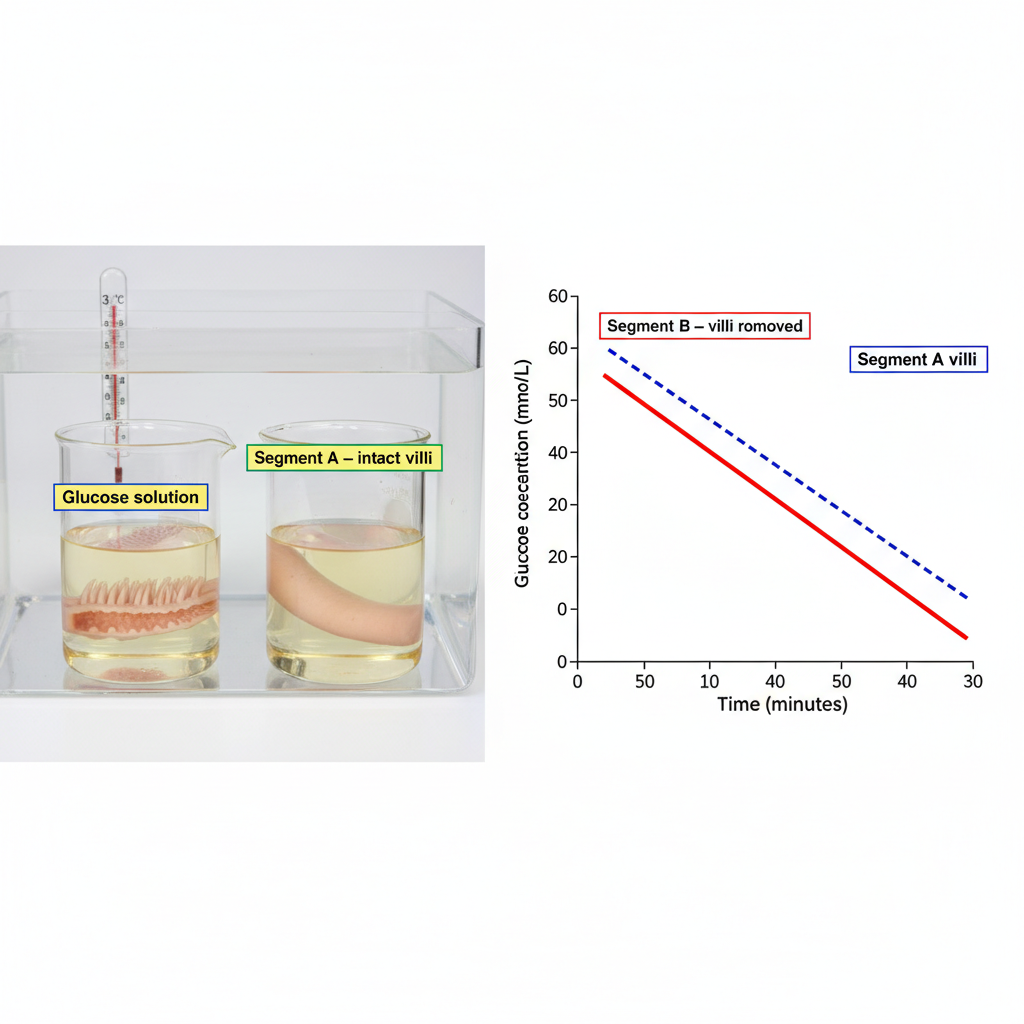
Two segments of rat small intestine were prepared: Segment A (intact villi) and Segment B (villi mechanically removed). Each segment was placed in 100 mL of a glucose solution at . Glucose concentration was measured every 10 minutes.
| Time (min) | 0 | 10 | 20 | 30 |
|---|---|---|---|---|
| Segment A — glucose concentration (mmol L) | 50 | 45 | 35 | 28 |
| Segment B — glucose concentration (mmol L) | 50 | 48 | 45 | 42 |
a
Describe the trend in glucose concentration for each segment over the 30-minute period. [1]
b
Explain how the structure of villi enables more efficient glucose absorption compared to intestinal tissue without villi. [2]
c
Evaluate whether this experimental evidence supports the hypothesis: "Villi increase the rate of glucose absorption in the small intestine." In your response, discuss the limitations of the experimental design. [2]
Solutions
5QuestionAccessory organsAssessment Practice
7 marks~11 minCriterion C
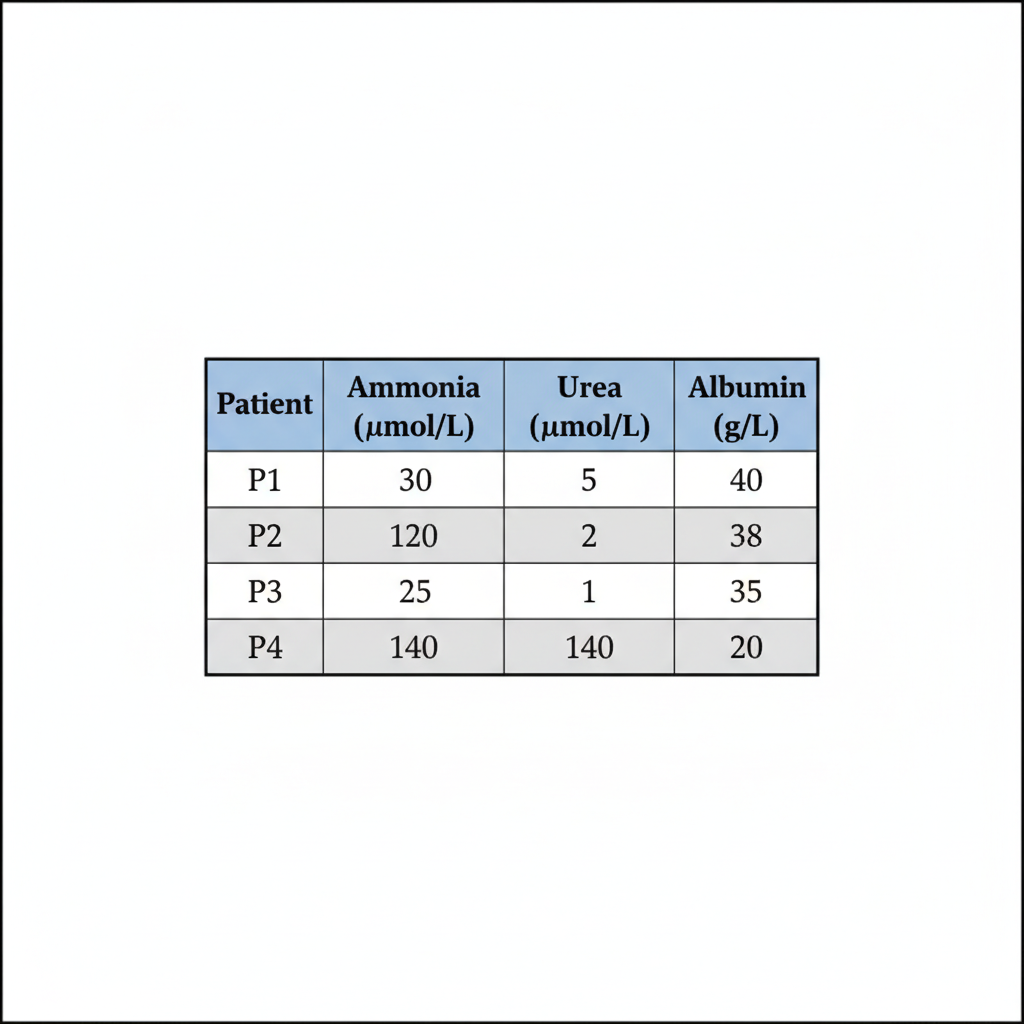
Blood samples from four patients were analysed for ammonia, urea, and albumin. Patient P1 is healthy; patients P2, P3, and P4 have liver dysfunction of varying types.
| Ammonia (mol/L) | P1 = 30 | P2 = 120 | P3 = 25 | P4 = 140 |
|---|---|---|---|---|
| Urea (mmol/L) | P1 = 5 | P2 = 2 | P3 = 1 | P4 = 4 |
| Albumin (g/L) | P1 = 40 | P2 = 38 | P3 = 35 | P4 = 20 |
a
Analyse the data to describe the relationship between blood ammonia and urea levels as indicators of liver function. [2]
b
Deduce which liver process — deamination, protein synthesis, or both — is most likely impaired in each of patients P2, P3, and P4. Justify each deduction using the data. [3]
c
Discuss how impaired protein synthesis in the liver leads to low albumin levels and evaluate one consequence of this for whole-body fluid balance. [2]
Solutions
That's every free question here — 5 of 102.
+97 more questions, plus Mock Papers & Worksheets, are waiting in Premium.