You're viewing free preview questions — 5 questions previewing here — subscribe to unlock 111 more, plus the Full Question Bank, Mock Papers & Worksheets.Upgrade
Skeletal System — Free MYP5 Biology Practice Questions

1QuestionCommon problemsConcept Practice
2 marks~3 minCriterion A
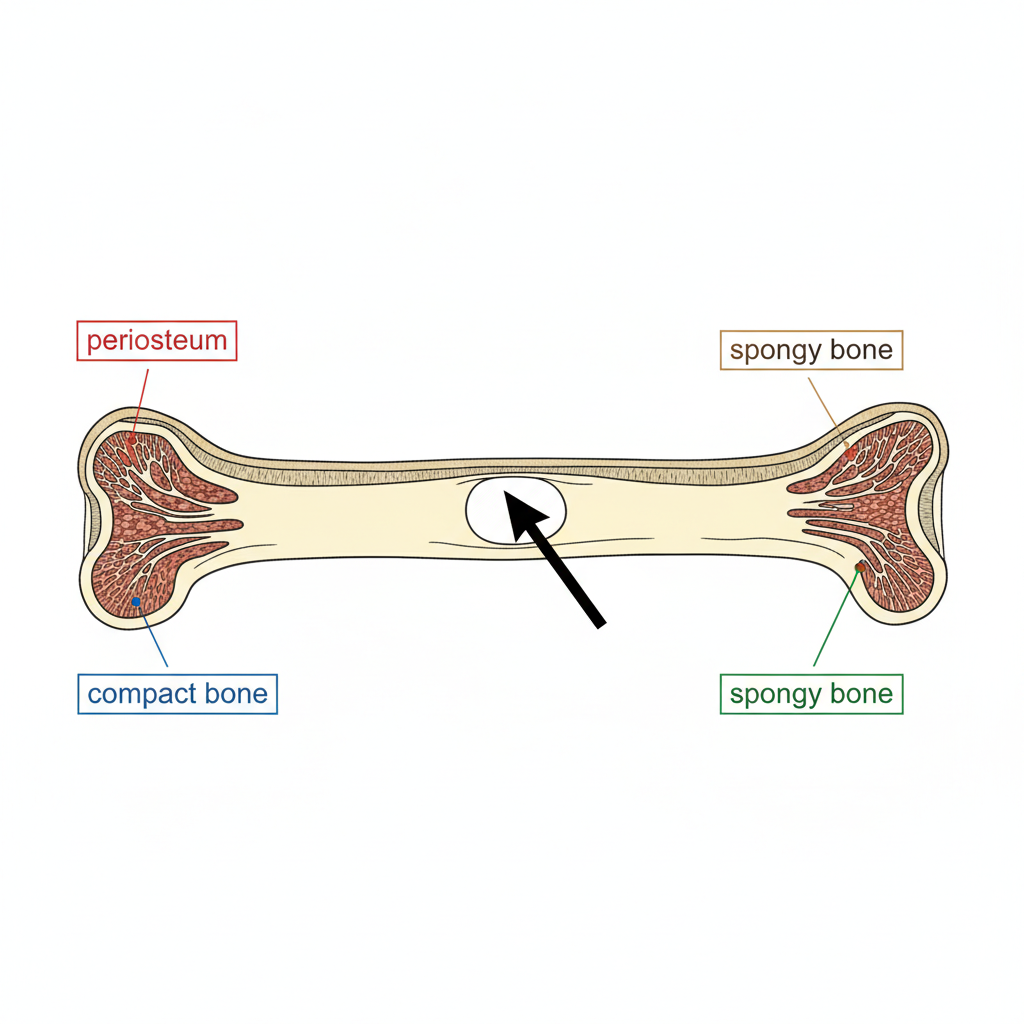
The diagram below shows a cross-section through the shaft (diaphysis) of a femur. An arrow points to the large central space within the bone.
a
Identify the structure indicated by the arrow. [1]
b
Explain one function of this structure. [1]

Solutions
2QuestionCommon problemsAssessment Practice
3 marks~5 minCriterion A
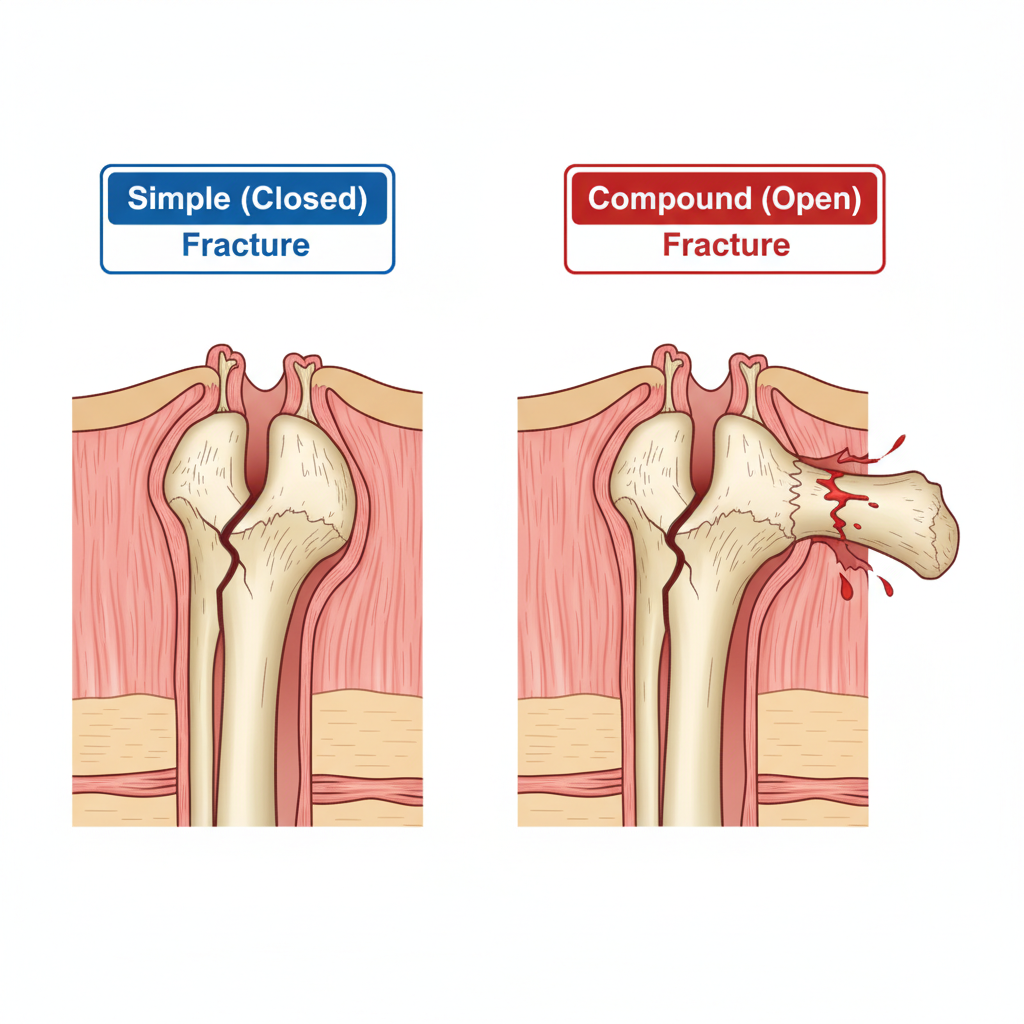
The diagram below shows a simple (closed) fracture and a compound (open) fracture of the femur.
a
State one structural difference between a simple fracture and a compound fracture. [1]
b
Explain the role of the periosteum in bone healing following a fracture. [1]
c
Analyse why a compound fracture is more likely to result in delayed healing than a simple fracture of the same bone. [1]
Solutions
3QuestionCommon problemsAssessment Practice
5 marks~8 minCriterion D
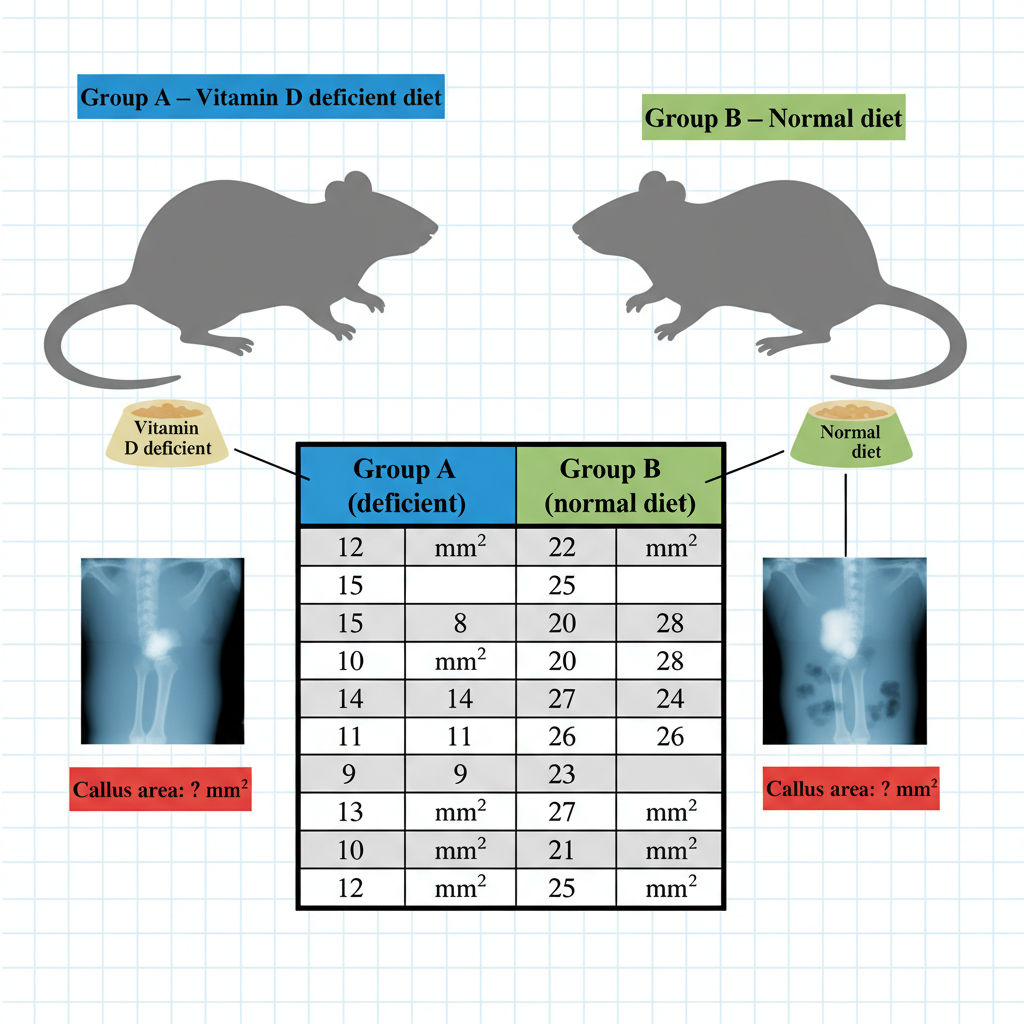
A controlled study investigated whether vitamin D deficiency delays bone fracture healing. Twenty rats with induced fractures were divided equally into two groups. Group A received a vitamin D-deficient diet; Group B received a normal diet. After four weeks, X-ray imaging measured callus formation area () at each fracture site.
Group A (vitamin D deficient): 12, 15, 10, 8, 14, 11, 9, 13, 10, 12
Group B (normal diet): 22, 25, 20, 28, 24, 26, 23, 27, 21, 25
Group A (vitamin D deficient): 12, 15, 10, 8, 14, 11, 9, 13, 10, 12
Group B (normal diet): 22, 25, 20, 28, 24, 26, 23, 27, 21, 25
a
Identify the independent variable and the dependent variable in this experiment. [1]
b
Calculate the mean callus formation area for each group and describe the trend shown by the data. [2]
c
Evaluate whether the data support the hypothesis that vitamin D deficiency delays bone fracture healing. In your answer, include the role of vitamin D in bone repair and at least one limitation of this study. [2]
Solutions
4QuestionFunctionsAssessment Practice
5 marks~8 minCriterion C
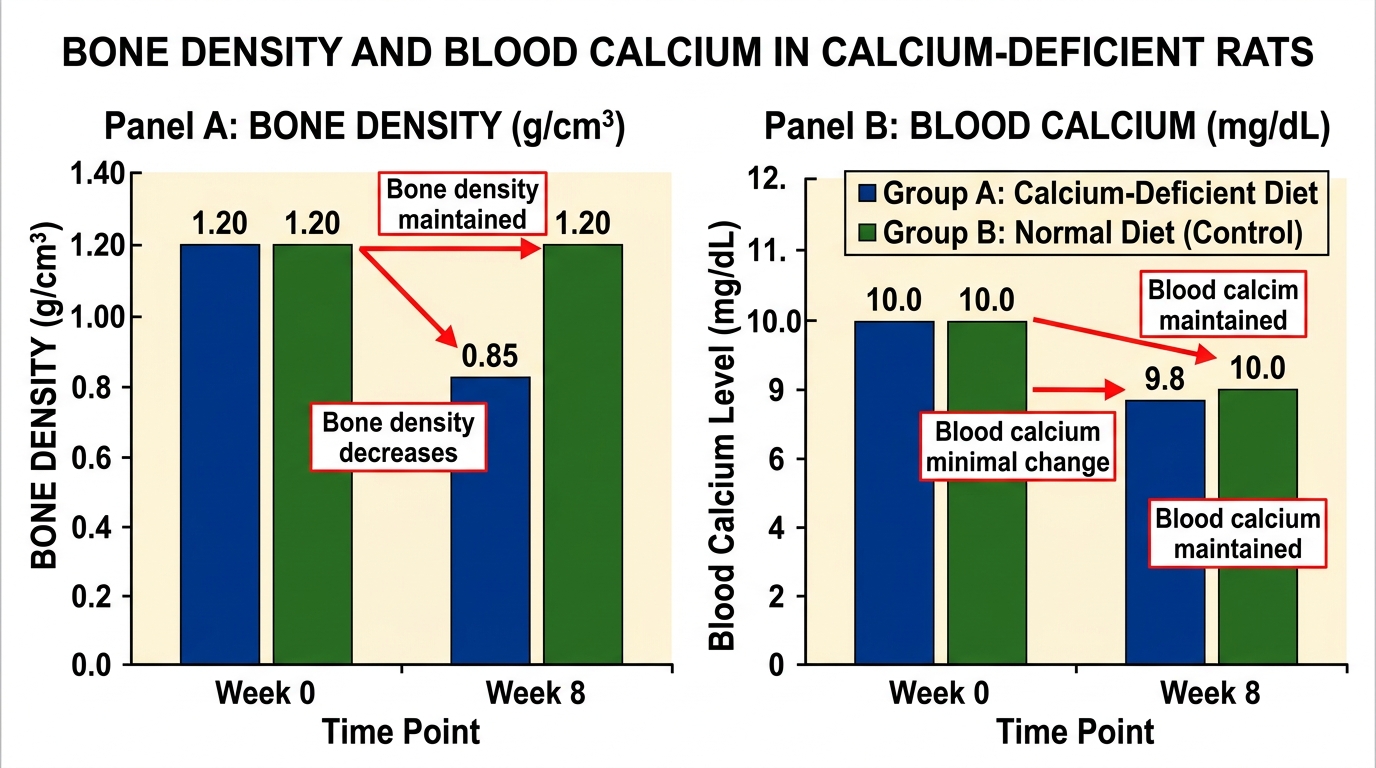
Two groups of rats were studied over 8 weeks. Group A received a calcium-deficient diet; Group B received a normal diet. Bone density and blood calcium were measured at week 0 and week 8.
Bone density (): Group A: week 0 = 1.20, week 8 = 0.85 | Group B: week 0 = 1.20, week 8 = 1.20
Blood calcium (): Group A: week 0 = 10.0, week 8 = 9.8 | Group B: week 0 = 10.0, week 8 = 10.0
Bone density (): Group A: week 0 = 1.20, week 8 = 0.85 | Group B: week 0 = 1.20, week 8 = 1.20
Blood calcium (): Group A: week 0 = 10.0, week 8 = 9.8 | Group B: week 0 = 10.0, week 8 = 10.0
a
Calculate the percentage decrease in bone density for Group A between week 0 and week 8. [1]
b
Explain how the roles of osteoclasts and parathyroid hormone (PTH) account for the changes observed in Group A. [2]
c
Evaluate whether the experimental data support the hypothesis: "The skeletal system prioritises maintaining blood calcium levels over preserving bone structural integrity." In your answer, discuss one limitation of the experimental design. [2]
Solutions
5QuestionFunctionsAssessment Practice
6 marks~9 minCriterion C
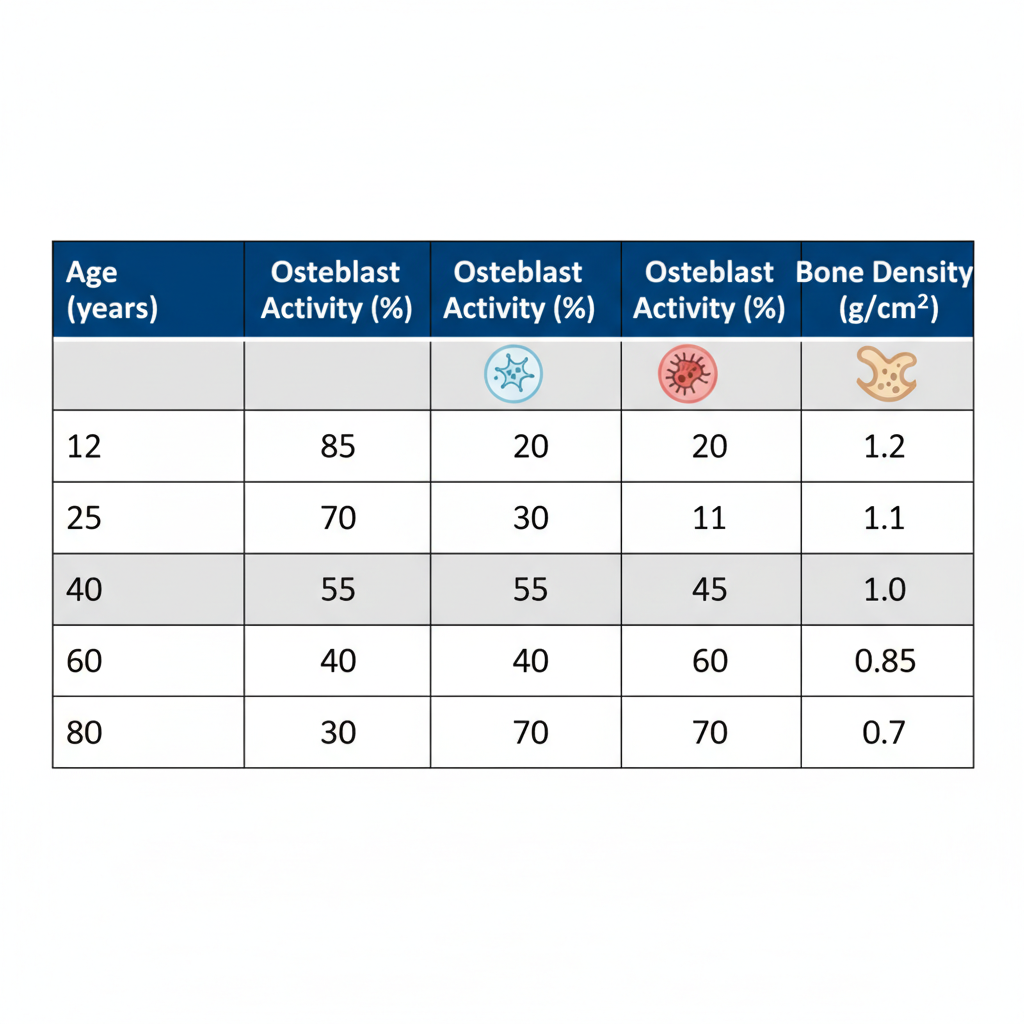
The table below shows osteoblast activity (bone formation) and osteoclast activity (bone resorption) alongside bone density for five individuals.
| Age (years) | 12 | 25 | 40 | 60 | 80 |
|---|---|---|---|---|---|
| Osteoblast activity (%) | 85 | 70 | 55 | 40 | 30 |
| Osteoclast activity (%) | 20 | 30 | 45 | 60 | 70 |
| Bone density (g/cm²) | 1.2 | 1.1 | 1.0 | 0.85 | 0.7 |
a
Analyse the trend in the balance between osteoblast and osteoclast activity as age increases. [2]
b
Using the data, calculate the average rate of bone density decline between ages 60 and 80, then deduce the expected bone density for a 70-year-old. [2]
c
Evaluate whether the shift in cellular activity balance is sufficient on its own to explain the decline in bone density, or whether additional biological factors must be considered. [2]
Solutions
That's every free question here — 5 of 116.
+111 more questions, plus Mock Papers & Worksheets, are waiting in Premium.