You're viewing free preview questions — 5 questions previewing here — subscribe to unlock 56 more, plus the Full Question Bank, Mock Papers & Worksheets.Upgrade
Friction Air Resistance and Terminal Velocity — Free MYP5 Physics Practice Questions

1QuestionApplications in Engineering and SportsConcept Practice
2 marks~3 minCriterion A
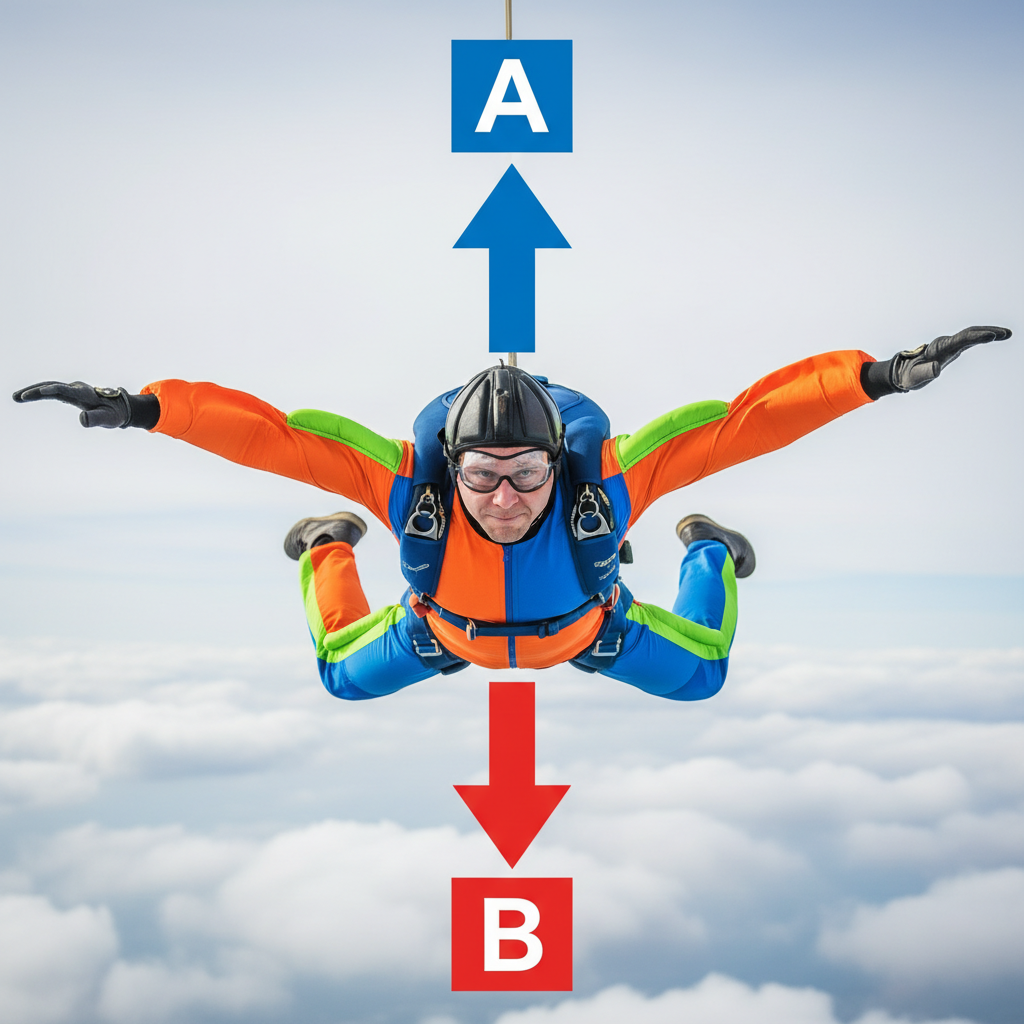
A skydiver falls at terminal velocity. The diagram shows two force arrows acting on the skydiver: arrow A points upward and arrow B points downward.
a
Identify the force represented by arrow A and explain why it acts in the direction shown. [1]
b
Identify the force represented by arrow B and explain why it acts in the direction shown. [1]

Solutions
2QuestionAir Resistance and StreamliningAssessment Practice
4 marks~6 minCriterion D
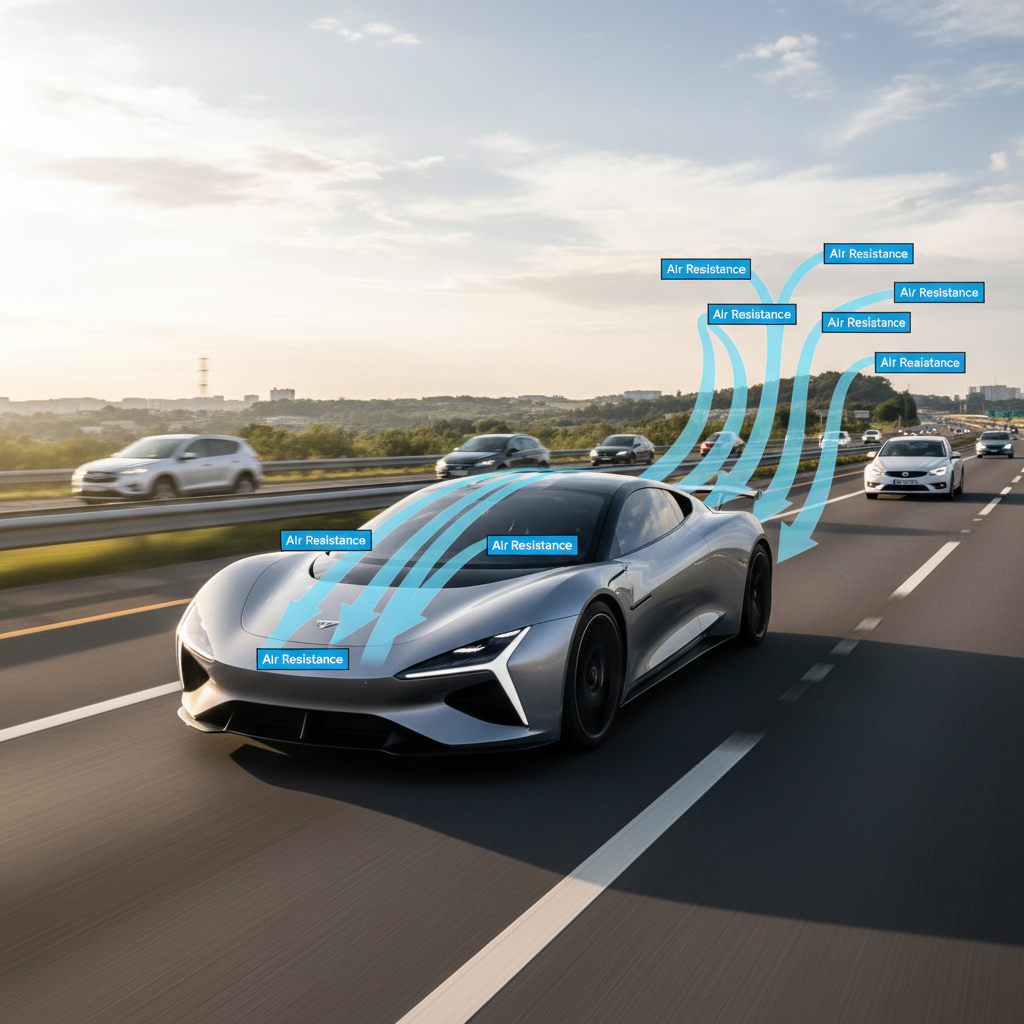
Modern electric vehicles (EVs) are designed with carefully shaped body panels, sloped windscreens, and sealed underbodies to reduce air resistance at highway speeds.
a
Identify the physics term for the force that streamlining reduces, and state one specific design feature of an EV that minimises this force. [1]
b
Explain how the streamlined shape of an EV reduces air resistance compared with a non-streamlined vehicle. [1]
c
Discuss the societal and environmental impacts of streamlining in EV design, considering both benefits and limitations. [2]
Solutions
3QuestionAir Resistance and StreamliningAssessment Practice
10 marks~15 minCriterion A
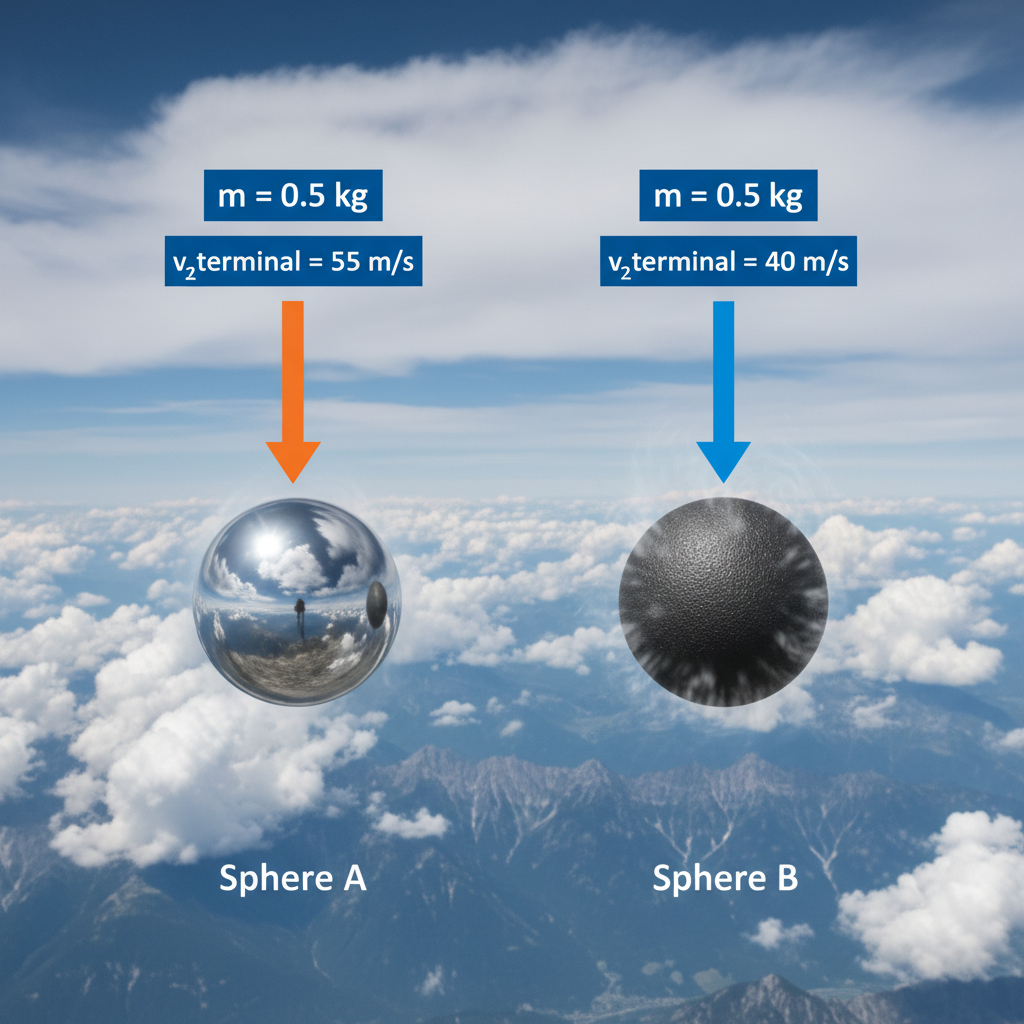
Two identical spheres, each of mass , are dropped simultaneously from rest at high altitude. Sphere A has a smooth surface; Sphere B has a rough surface. Both experience significant air resistance (). The velocity–time graph shows each sphere accelerating until it reaches terminal velocity: Sphere A at , Sphere B at .
a
Calculate the drag force acting on Sphere A at its terminal velocity. [2]
b
Deduce the drag force acting on Sphere B at its terminal velocity, and explain why your answer is the same as in part (a) despite the two spheres reaching different terminal velocities. [3]
c
The drag force on a sphere is given by , where is the drag coefficient, is air density, is cross-sectional area, and is speed. Using this equation and your results from parts (a) and (b), analyse how the rough surface of Sphere B produces a lower terminal velocity than the smooth surface of Sphere A. [5]
Solutions
4QuestionFriction Causes Effects and ReductionAssessment Practice
12 marks~18 minCriterion C
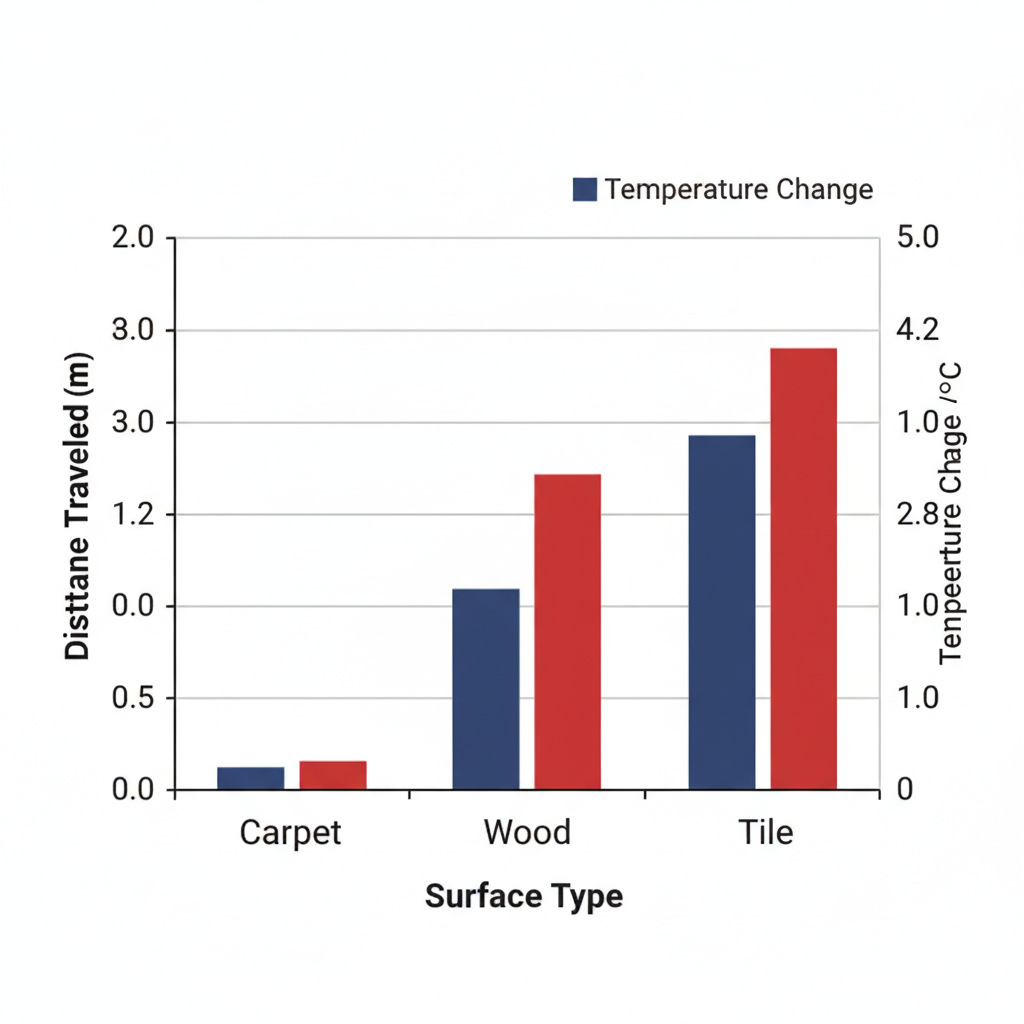
A toy car is released from rest at the top of a ramp and rolls onto a flat surface. Students measured the distance the car travelled and the temperature rise of its axles after each run across three surfaces. The car was released from the same height each time.
| Distance travelled (m) | Carpet 0.4 | Wood 1.1 | Tile 1.8 |
|---|---|---|---|
| Axle temperature rise (°C) | Carpet 4.2 | Wood 2.1 | Tile 0.7 |
a
Explain how the data provides evidence that friction converts kinetic energy into thermal energy. [3]
b
Analyse the relationship between surface texture and the amount of energy converted by friction, using values from the data. [4]
c
A student claims: "The total mechanical energy of the car is not conserved in this experiment, so the law of conservation of energy does not apply." Evaluate this claim, identifying one limitation of the experimental evidence that affects how confidently the claim can be assessed. [5]
Solutions
5QuestionAir Resistance and StreamliningAssessment Practice
12 marks~18 minCriterion D
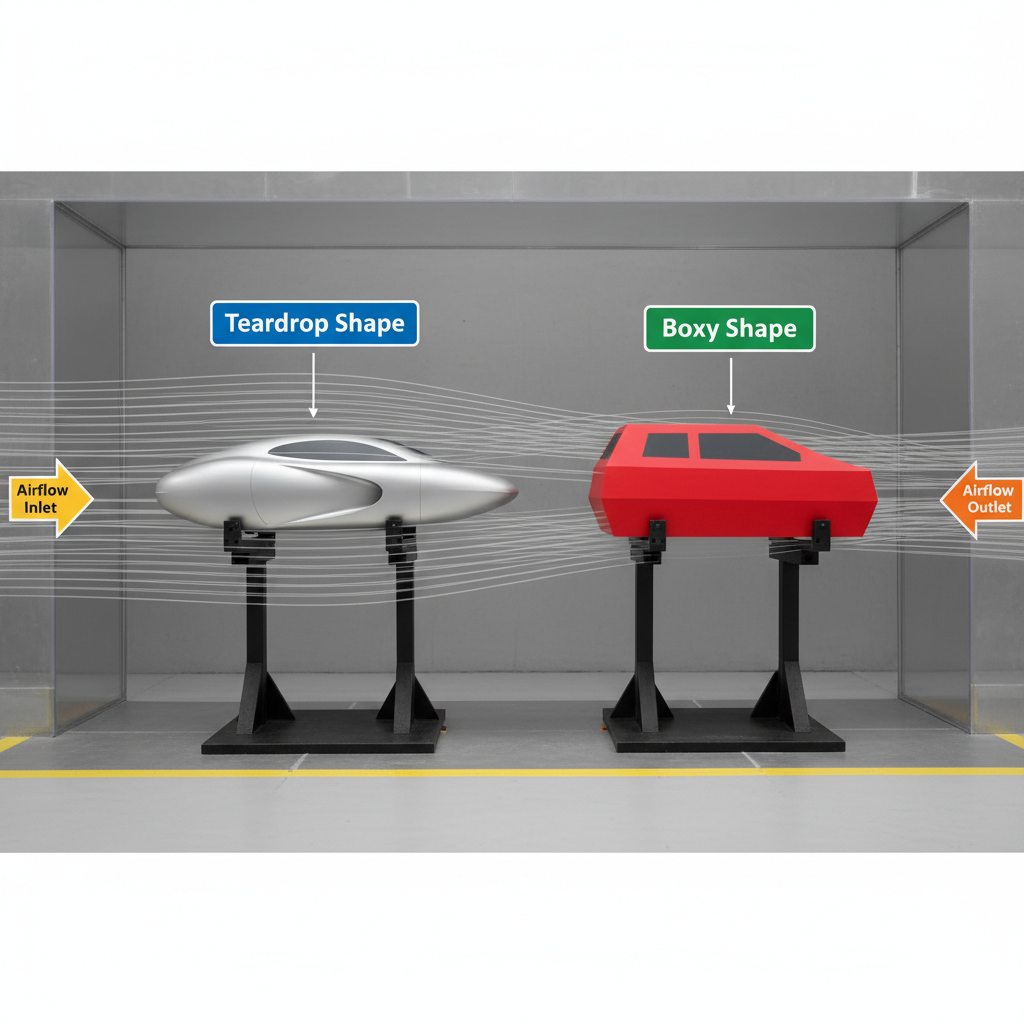
A car manufacturer tests two electric vehicle body shapes — a teardrop and a boxy design — in a wind tunnel to minimise air resistance. Wind tunnel data show the teardrop shape produces a drag force of 120 N at 30 m s, while the boxy shape produces 310 N at the same speed. The electric motor delivers a constant power output of 18 kW.
a
Explain how the teardrop shape reduces air resistance compared with the boxy shape. [3]
b
Using the drag force values, analyse how the difference in air resistance affects the energy available to propel each vehicle over a 10-minute journey at 30 m s. [4]
c
Evaluate the limitations of wind tunnel testing in predicting the aerodynamic performance of a vehicle under real-world driving conditions. [5]
Solutions
That's every free question here — 5 of 61.
+56 more questions, plus Mock Papers & Worksheets, are waiting in Premium.