You're viewing free preview questions — 5 questions previewing here — subscribe to unlock 117 more, plus the Full Question Bank, Mock Papers & Worksheets.Upgrade
Motion Graphs Distance-Time and Speed-Time — Free MYP5 Physics Practice Questions

1QuestionCalculating Acceleration and Area Under GraphsAssessment Practice
2 marks~3 minCriterion D
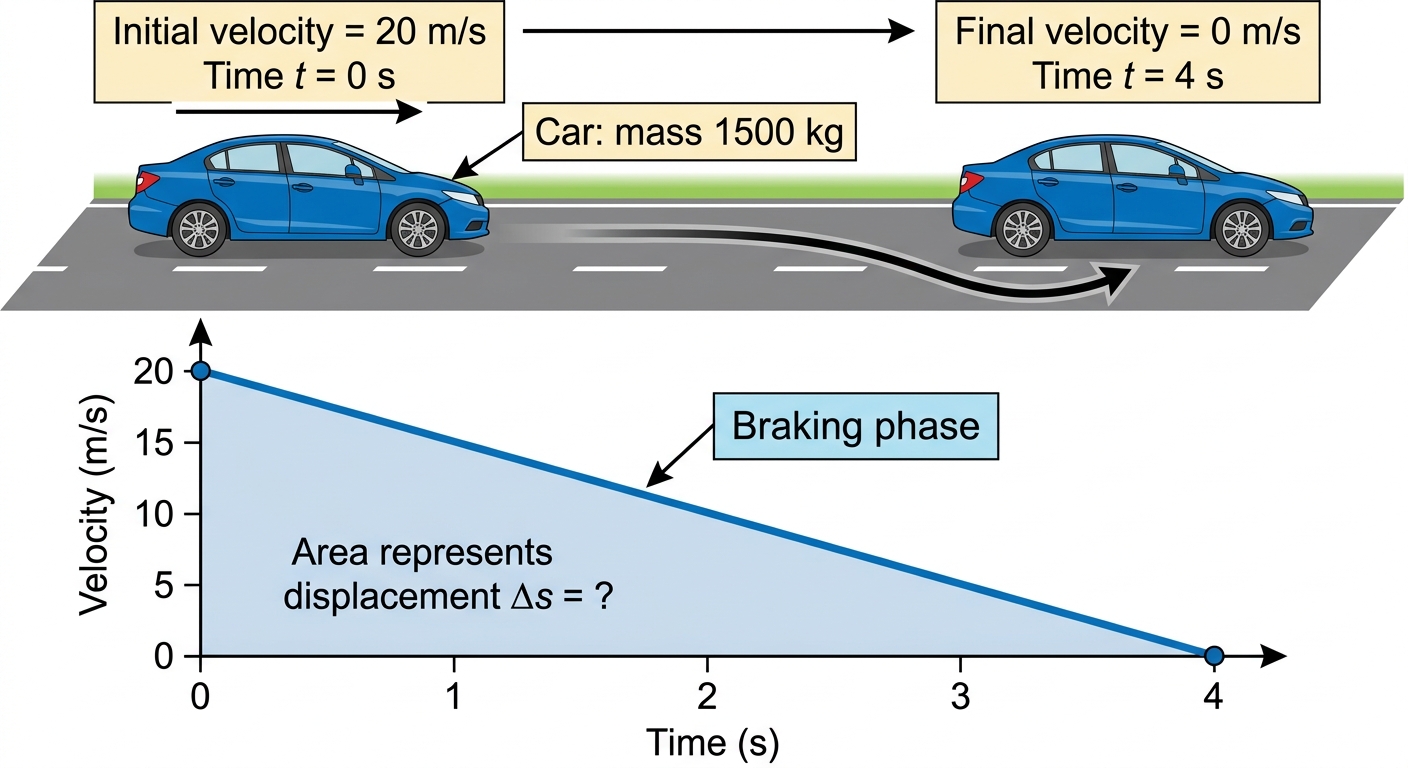
During a brake test, a car decelerates uniformly from to rest in .
a
State one way automotive engineers use the acceleration calculated from a velocity-time graph to improve vehicle safety. [1]
b
Justify why average acceleration alone may be insufficient for designing a reliable braking system. [1]

Solutions
2QuestionInterpreting Distance-Time GraphsAssessment Practice
4 marks~6 minCriterion C
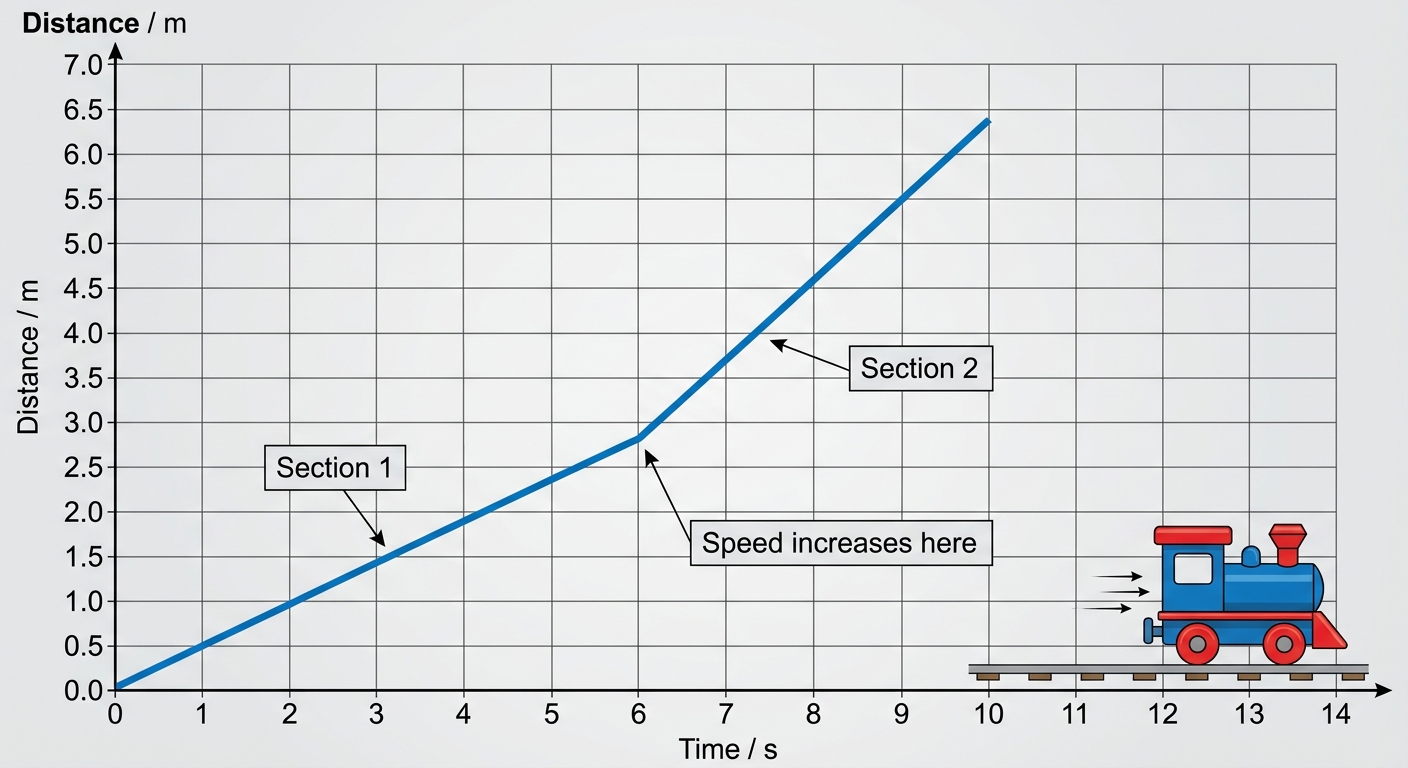
A cyclist's motion along a straight road is recorded and plotted as a distance–time graph. For the first 8 s, the line is straight, passing through (0, 0) and (8, 16). At , the line becomes noticeably steeper and remains straight, reaching (18, 66) at the end of the journey.
a
Deduce the time at which the cyclist's speed changes, and state what feature of the graph supports this. [1]
b
Calculate the speed of the cyclist in each section, showing full working. [2]
c
Analyse how the distance–time graph would differ if the speed had increased gradually rather than suddenly, justifying your answer in terms of gradient. [1]
Solutions
3QuestionCalculating Acceleration and Area Under GraphsAssessment Practice
4 marks~6 minCriterion A
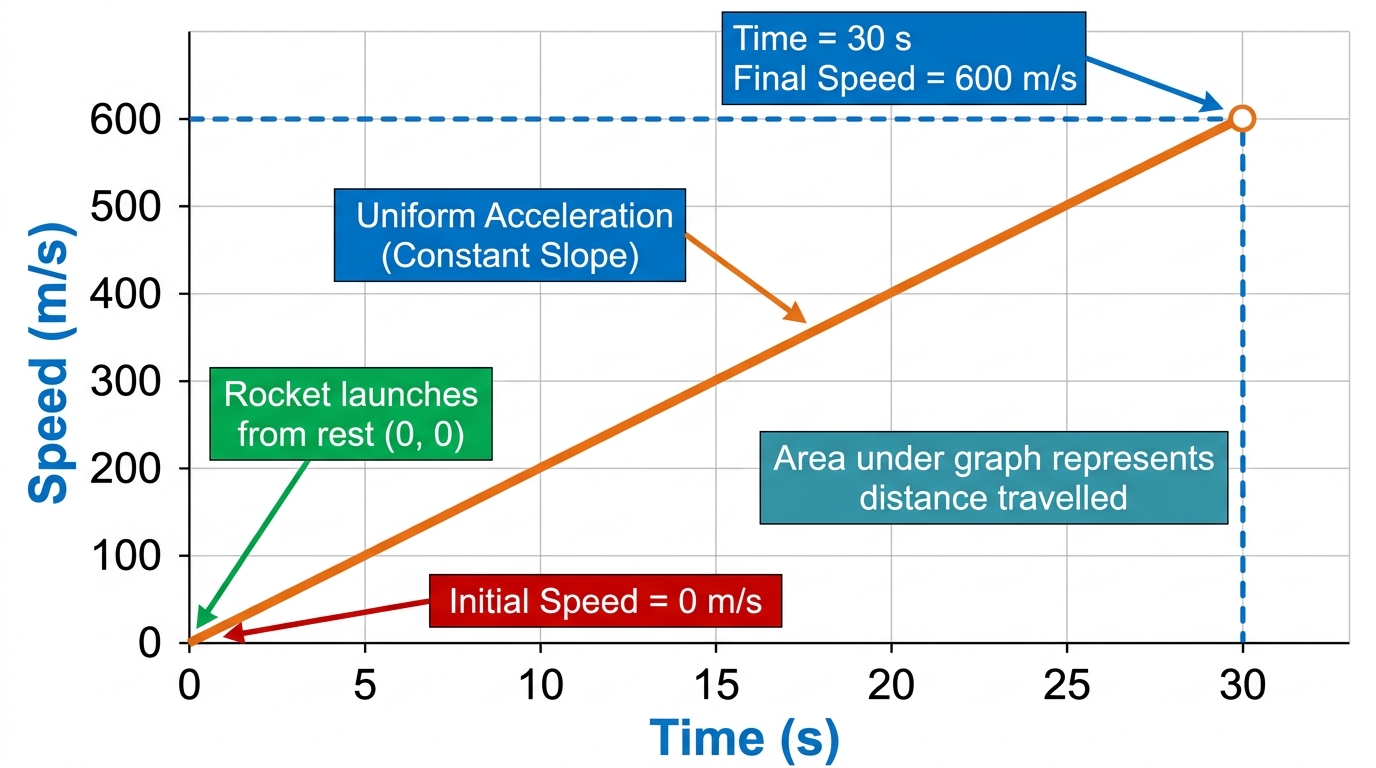
A rocket launches from rest and reaches a speed of in with uniform acceleration.
a
Calculate the acceleration of the rocket during the launch. [1]
b
Deduce the distance travelled in the first by finding the area under the speed-time graph. [1]
c
The rocket instead reaches in . Evaluate the effect of this change on both the acceleration and the distance travelled. Justify your answer with quantitative reasoning. [2]
Solutions
4QuestionCalculating Speed from a GraphAssessment Practice
6 marks~9 minCriterion C
Data
| Time (s) | 0.0 | 1.0 | 2.0 | 3.0 | 4.0 | 5.0 |
|---|---|---|---|---|---|---|
| Distance (m) | 0.0 | 0.5 | 2.0 | 4.5 | 8.0 | 12.5 |
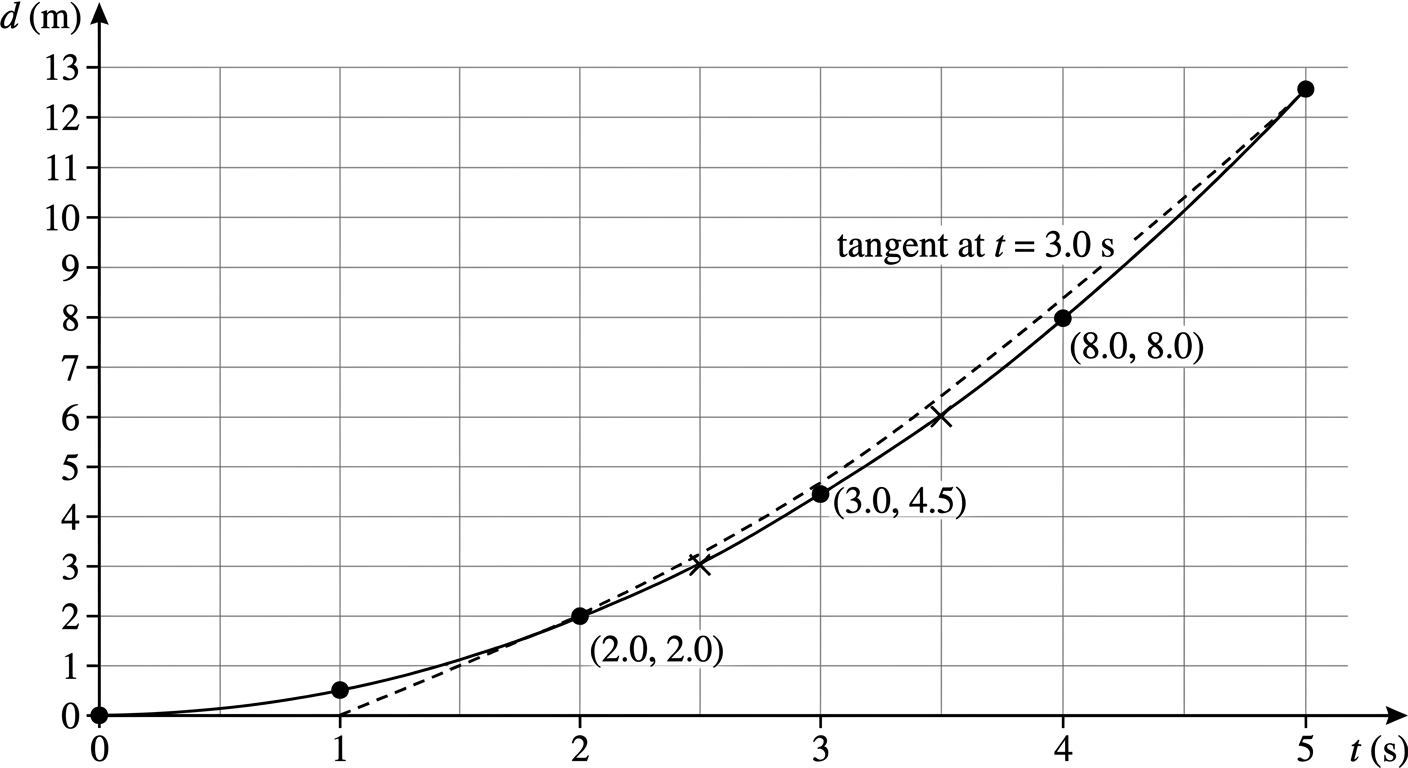
A toy car accelerates from rest along a straight track. A motion sensor records the following
a
Construct a distance–time graph for this data. Draw a smooth curve through all six points. [2]
b
Deduce the instantaneous speed of the car at by drawing a tangent to the curve at that point. Show all working. [2]
c
The motion sensor has a resolution of . Analyse how this limitation affects the reliability of the instantaneous speed you deduced in (b), and suggest one way to reduce this effect. [2]
Solutions
5QuestionDescribing Motion Qualitatively and QuantitativelyAssessment Practice
8 marks~12 minCriterion D
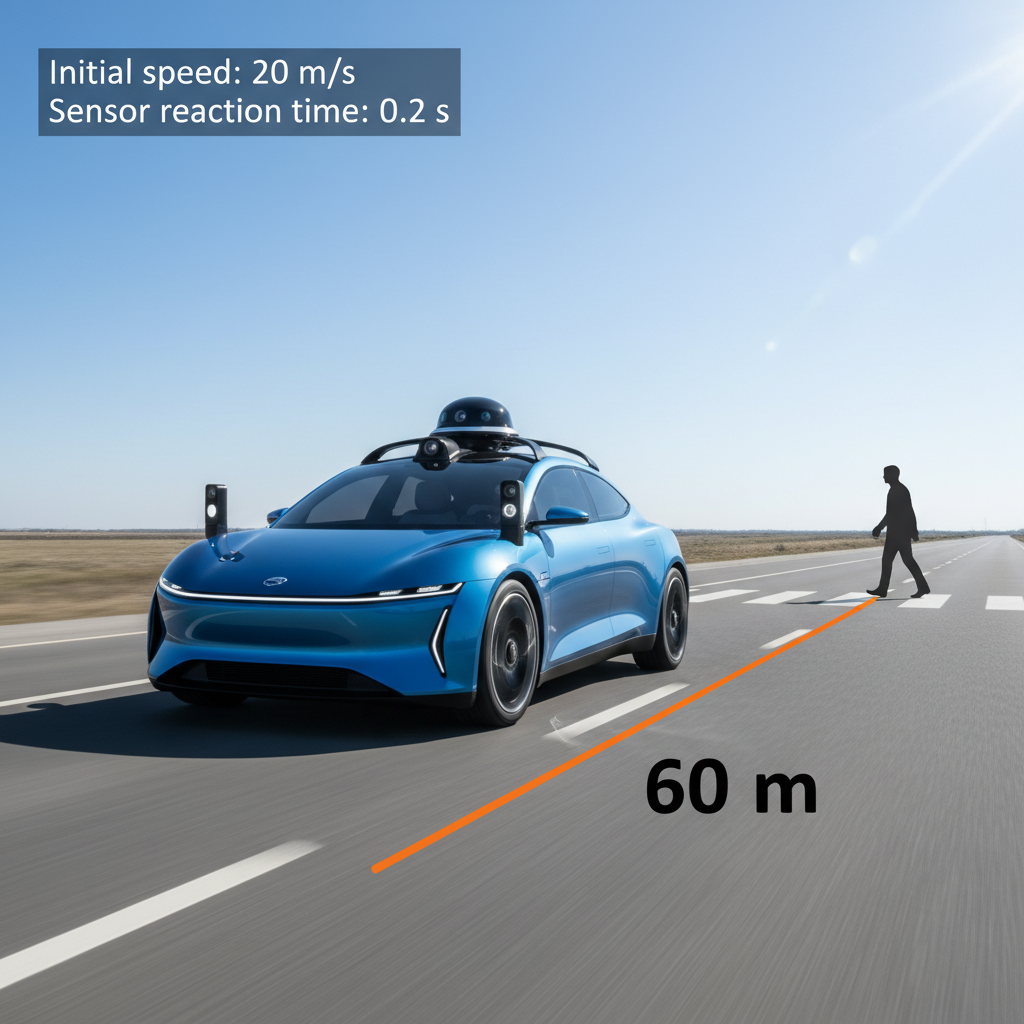
A self-driving car is travelling at when a pedestrian steps into the road ahead. The car's sensor system has a reaction time of before braking begins. Two braking profiles are available: a smooth profile with constant deceleration , and an emergency profile with constant deceleration .
a
Calculate the total stopping distance for the smooth profile. Use to find the braking distance. [2]
b
Calculate the total stopping distance for the emergency profile and deduce, with reference to your answers, which profile prevents a collision. [2]
c
Evaluate the ethical justification for a manufacturer programming the smooth profile as the default, considering how risk is distributed between passengers and pedestrians and how real-world conditions such as wet roads or sensor latency affect the reliability of the stopping-distance model. [4]
Solutions
That's every free question here — 5 of 122.
+117 more questions, plus Mock Papers & Worksheets, are waiting in Premium.