You're viewing free preview questions — 4 questions previewing here — subscribe to unlock 75 more, plus the Full Question Bank, Mock Papers & Worksheets.Upgrade
Renewable and Non-Renewable Resources — Free MYP2 Sciences Practice Questions

1QuestionComparing Energy Resources for SustainabilityConcept Practice
2 marks~3 minCriterion A
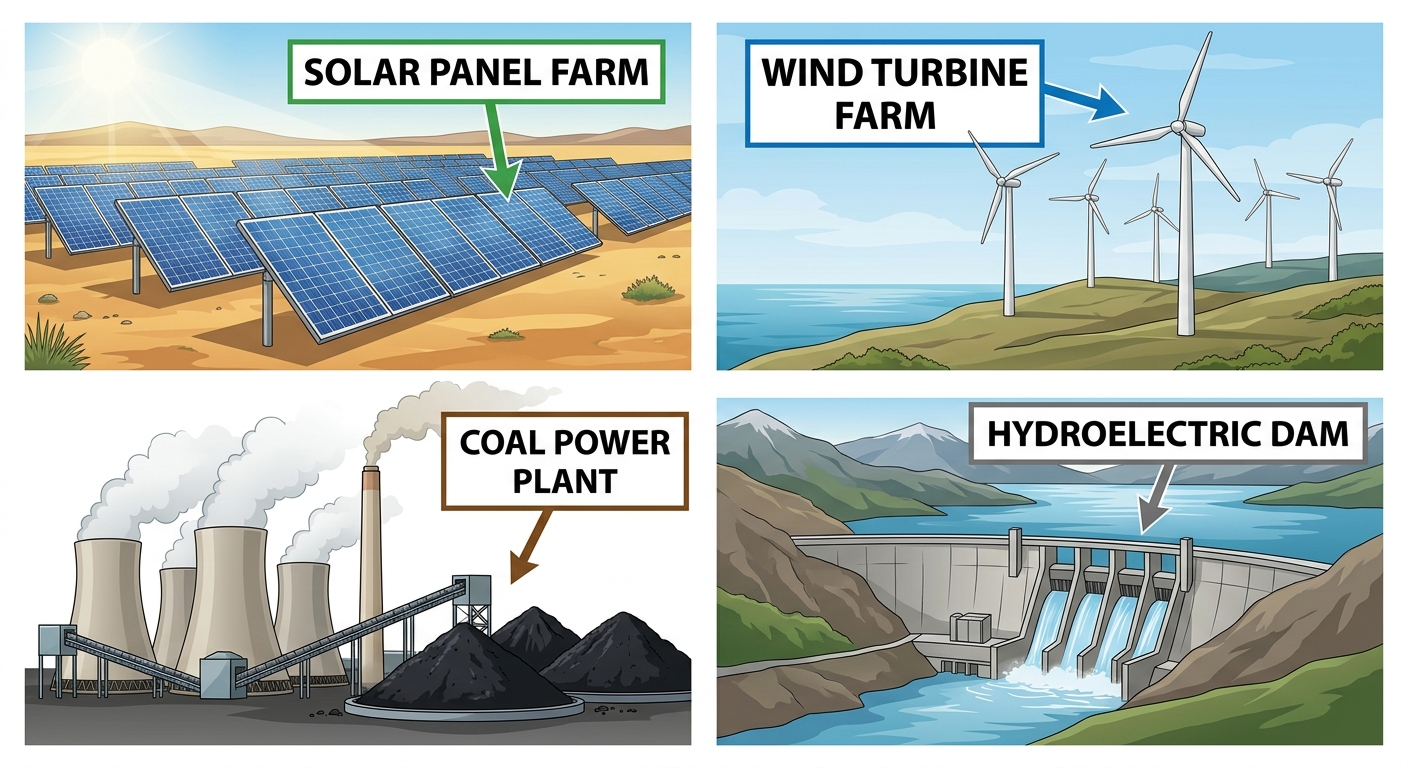
The diagram shows four energy sources: a solar panel, a wind turbine, a coal power plant, and a hydroelectric dam.
a
Identify each energy source as renewable (R) or non-renewable (NR).
Solar panel: ___ Wind turbine: ___ Coal power plant: ___ Hydroelectric dam: ___ [1]
Solar panel: ___ Wind turbine: ___ Coal power plant: ___ Hydroelectric dam: ___ [1]
b
Explain why coal is classified differently from the other three sources. [1]

Solutions
2QuestionComparing Energy Resources for SustainabilityAssessment Practice
4 marks~6 minCriterion D
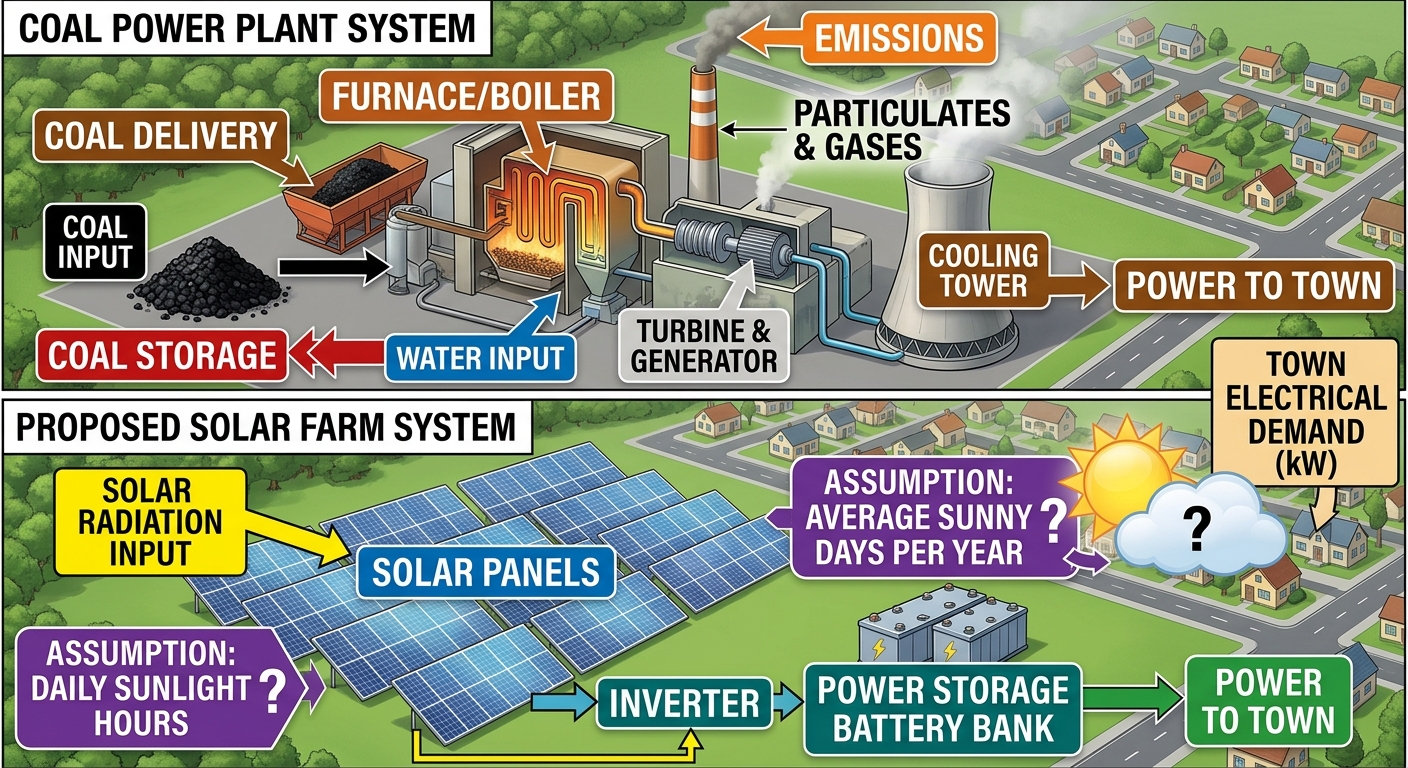
A town currently uses a coal power plant for electricity. The local government is considering switching to a solar energy farm.
a
Identify one benefit of switching from coal to solar energy. [1]
b
Describe one limitation of using solar energy for this town. [1]
c
Explain how assuming a high number of sunny days per year could affect the accuracy of this decision. [2]
Solutions
3QuestionComparing Energy Resources for SustainabilityAssessment Practice
5 marks~8 minCriterion C
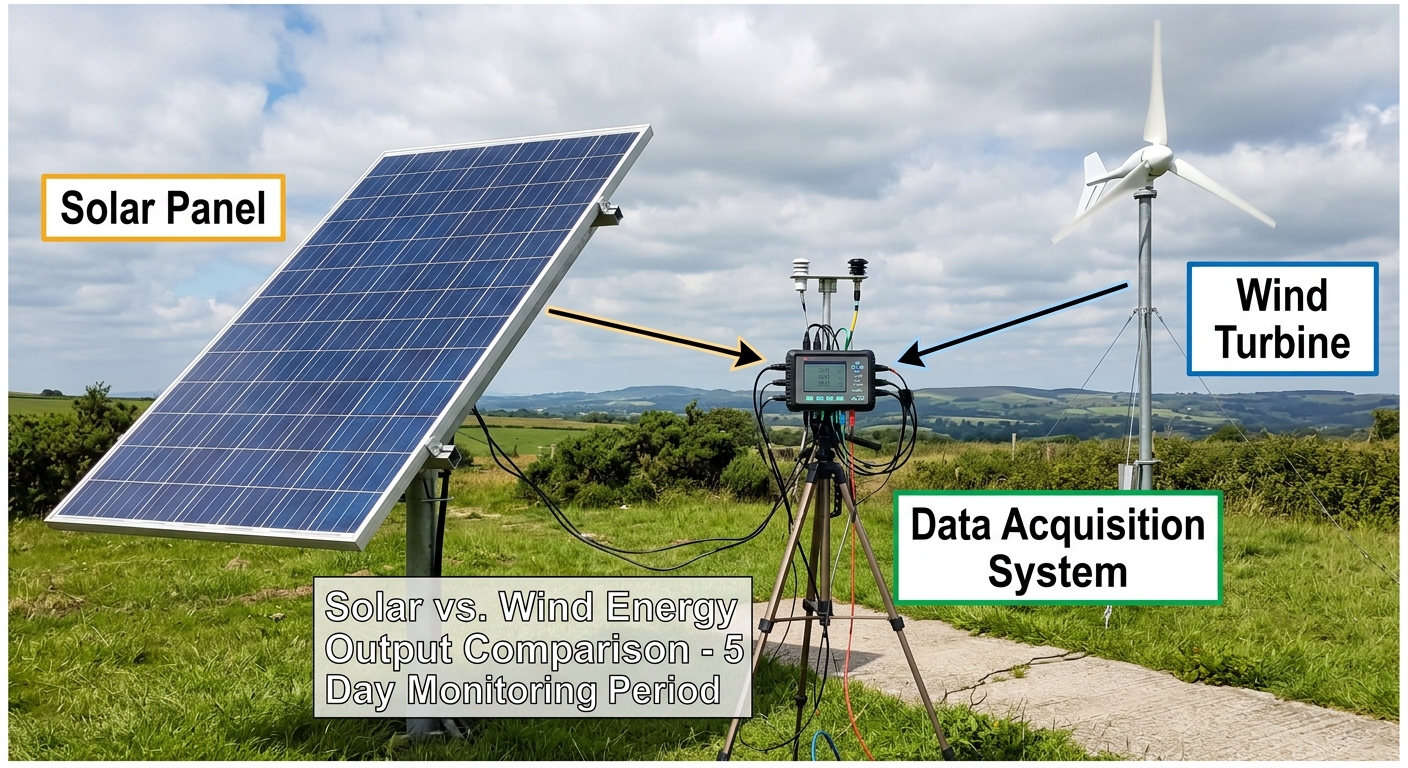
A student tests a solar panel and a small wind turbine over five days.
A classmate claims: "Wind turbines always produce more energy than solar panels in all conditions."
| Day 1 (Sunny, calm) | Solar = 500 J | Wind = 50 J |
|---|---|---|
| Day 2 (Sunny, windy) | Solar = 480 J | Wind = 400 J |
| Day 3 (Cloudy, calm) | Solar = 150 J | Wind = 40 J |
| Day 4 (Cloudy, windy) | Solar = 120 J | Wind = 350 J |
| Day 5 (Rainy, windy) | Solar = 80 J | Wind = 300 J |
A classmate claims: "Wind turbines always produce more energy than solar panels in all conditions."
a
Identify which energy source produced more energy on Day 1. [1]
b
Explain why the data from Days 1, 2, and 3 contradicts the classmate's claim. [2]
c
Compare the overall evidence from all five days and discuss whether five days of data is enough to draw a general conclusion about which energy source is better. [2]
Solutions
4QuestionSolar Wind and Hydro Energy BasicsAssessment Practice
6 marks~9 minCriterion B
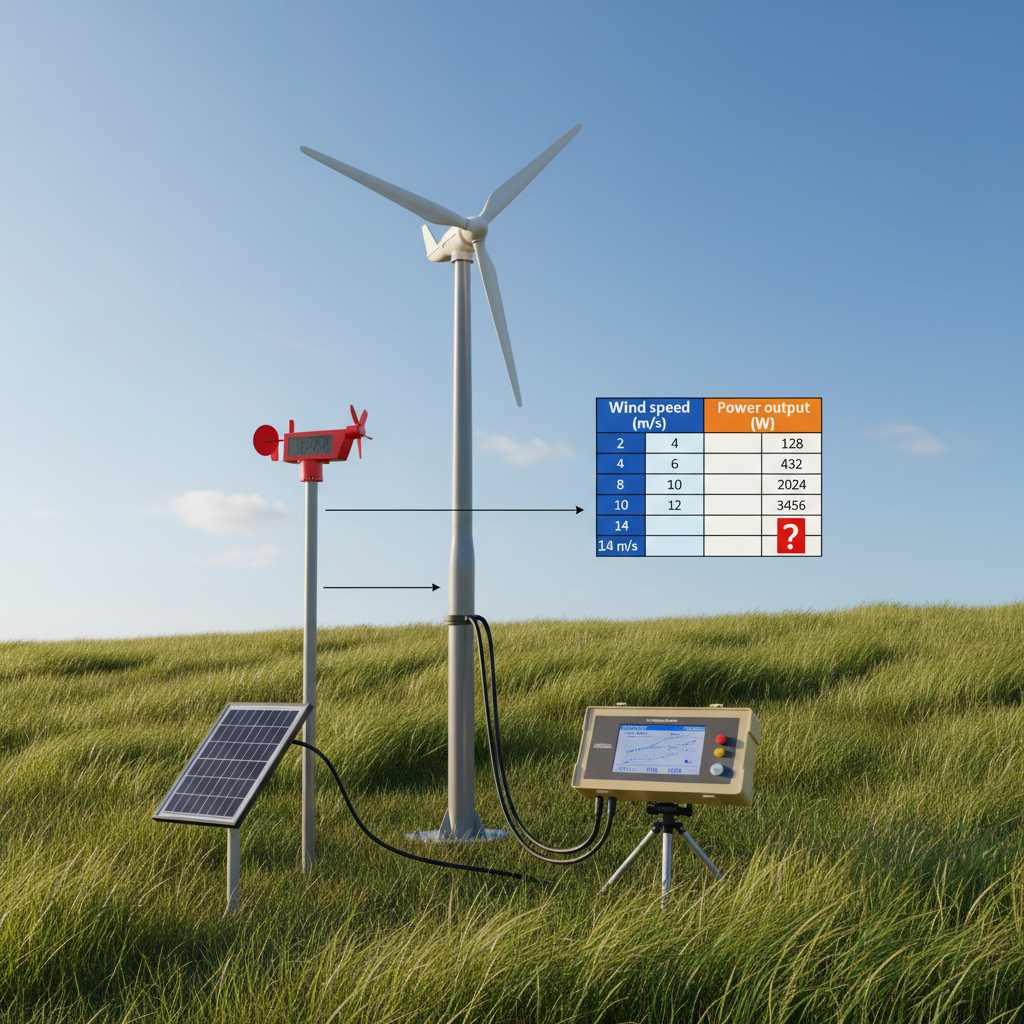
Students test a small wind turbine and record the following data.
| Wind speed (m/s) | 2 | 4 | 6 | 8 | 10 | 12 |
|---|---|---|---|---|---|---|
| Power output (W) | 16 | 128 | 432 | 1024 | 2000 | 3456 |
a
Identify the pattern linking power output to wind speed. [1]
b
Calculate the predicted power output at a wind speed of 14 m/s. Show your working. [2]
c
Explain why this pattern makes sense for a wind turbine. [3]
Solutions
That's every free question here — 4 of 79.
+75 more questions, plus Mock Papers & Worksheets, are waiting in Premium.