You're viewing free preview questions — 4 questions previewing here — subscribe to unlock 75 more, plus the Full Question Bank, Mock Papers & Worksheets.Upgrade
Biodiversity and Conservation — Free MYP3 Sciences Practice Questions

1QuestionDefinition and Importance of BiodiversityConcept Practice
2 marks~3 minCriterion A
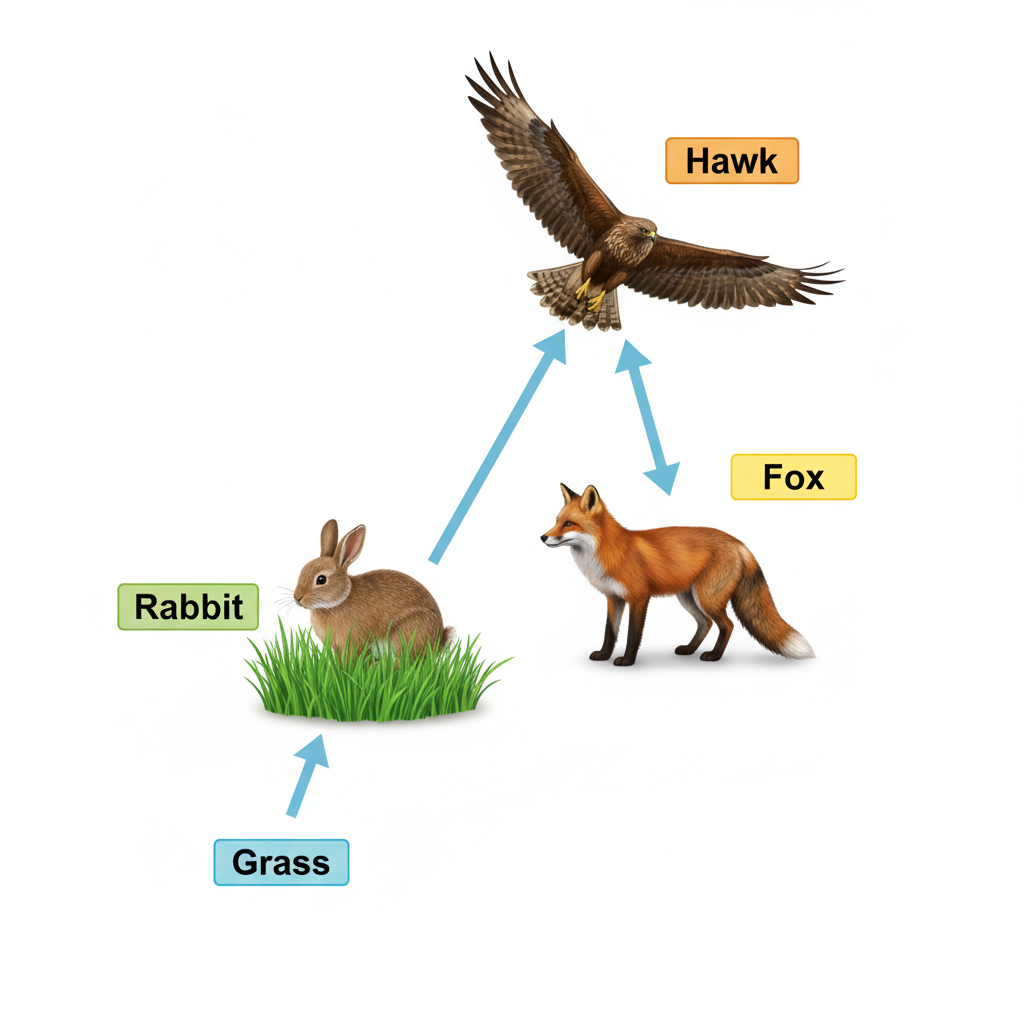
The food web below shows four organisms: grass, rabbit, fox, and hawk.
a
Identify the producer in this food web. [1]
b
Explain why the rabbit is classified as a primary consumer in this food web. [1]

Solutions
2QuestionDefinition and Importance of BiodiversityAssessment Practice
4 marks~6 minCriterion D
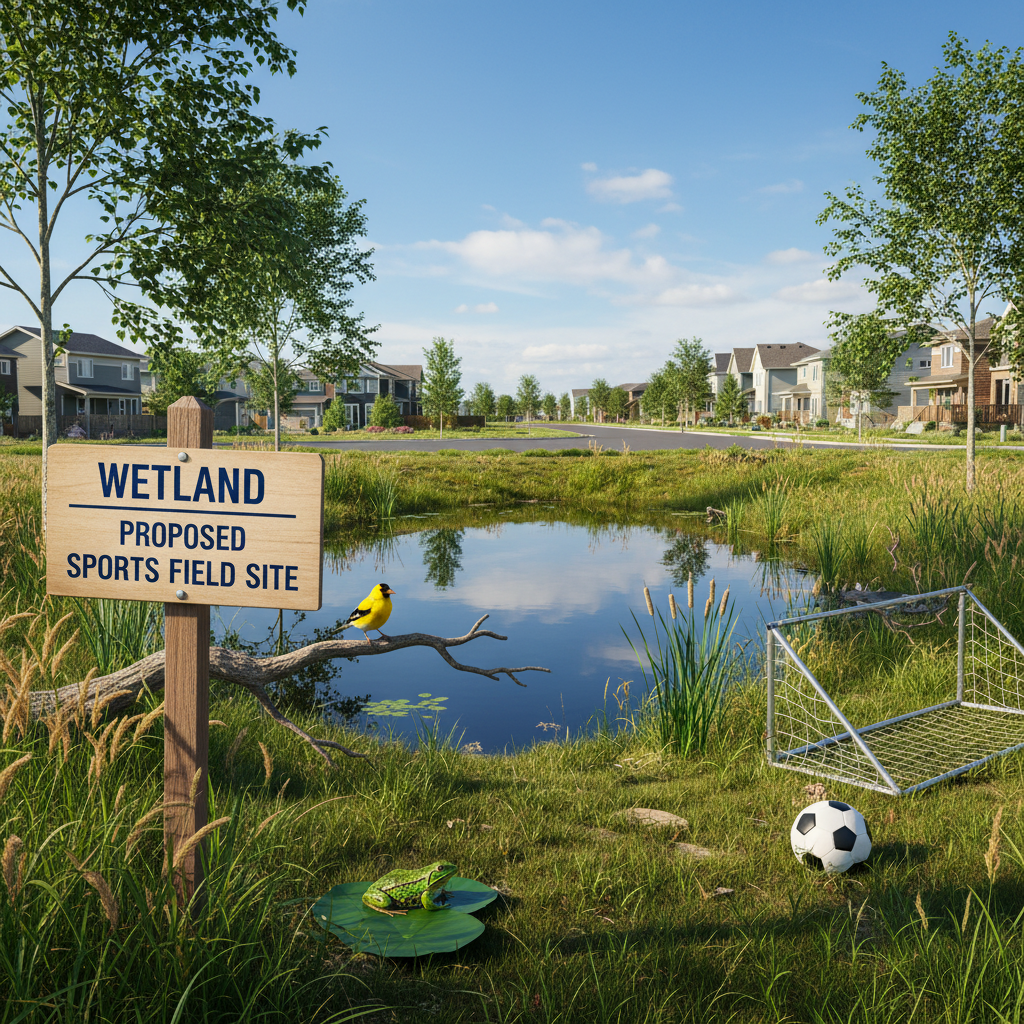
A local council is considering converting a small urban wetland into a sports field. The wetland currently provides several ecosystem services because of its biodiversity.
a
Describe two ecosystem services that the wetland's biodiversity provides to the local community. [2]
b
Explain one reason why depending on biodiversity to deliver these ecosystem services may be unreliable. [2]
Solutions
3QuestionMethods of ConservationConcept Practice
2 marks~3 minCriterion B
A conservation team investigates how the number of native shrubs planted affects bird species diversity. They plant 50 shrubs in Plot A, 100 shrubs in Plot B, and 150 shrubs in Plot C. After one year, they count the number of bird species in each plot. Rainfall is kept the same across all plots.
a
Identify the independent variable and the dependent variable in this investigation. [1]
b
Explain why keeping rainfall the same across all plots is important in this investigation. [1]
Solutions
4QuestionMethods of ConservationAssessment Practice
5 marks~8 minCriterion C
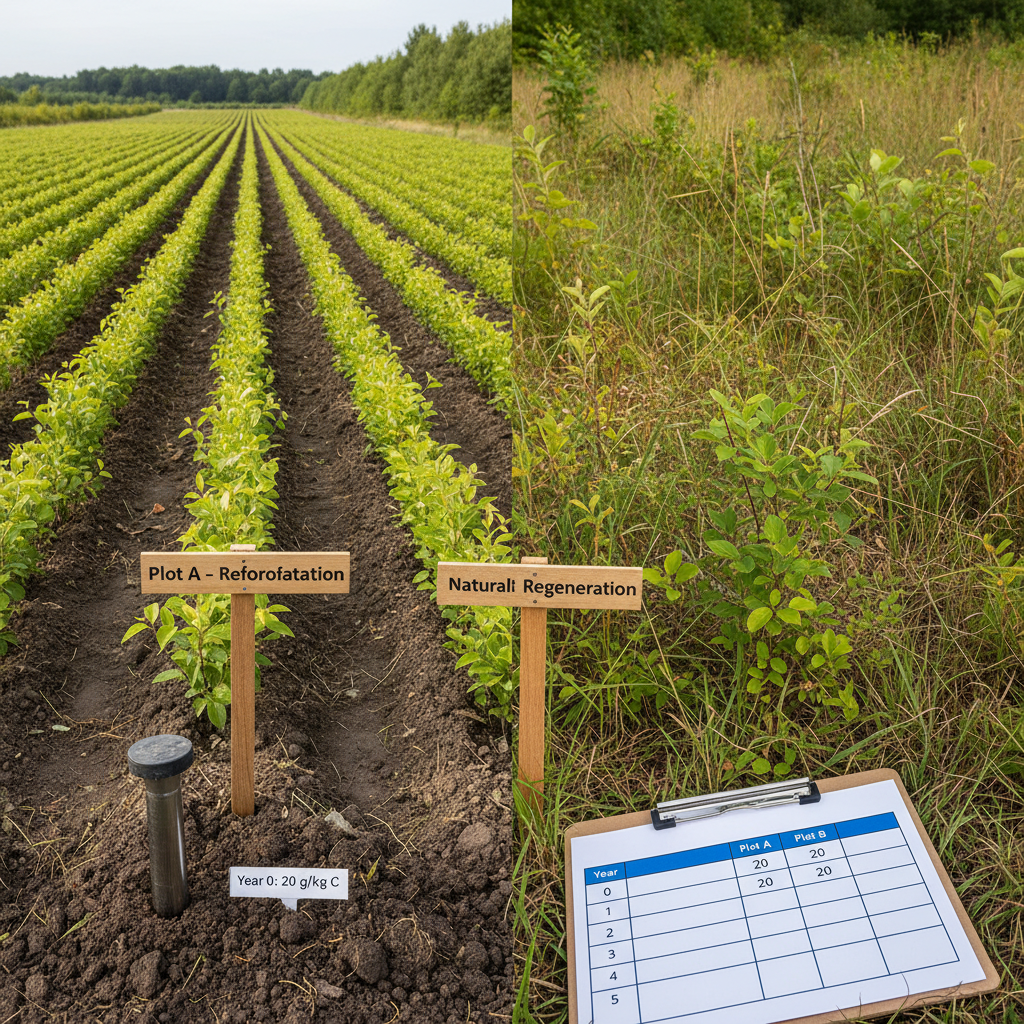
A scientist claims that reforestation increases soil carbon by 15\% per year. To investigate this, soil carbon (g/kg) was measured in two forest plots over 5 years.
Plot A (reforestation) — Year 0: 20, Year 1: 23, Year 2: 26, Year 3: 30, Year 4: 35, Year 5: 40
Plot B (natural regeneration) — Year 0: 20, Year 1: 21, Year 2: 22, Year 3: 23, Year 4: 24, Year 5: 25
Plot A (reforestation) — Year 0: 20, Year 1: 23, Year 2: 26, Year 3: 30, Year 4: 35, Year 5: 40
Plot B (natural regeneration) — Year 0: 20, Year 1: 21, Year 2: 22, Year 3: 23, Year 4: 24, Year 5: 25
a
Calculate the total percentage increase in soil carbon for Plot A over the 5-year period. [2]
b
Calculate the mean annual percentage increase in soil carbon for Plot A. [1]
c
Compare the mean annual percentage increase for Plot A with the scientist's claim. Justify whether the data supports the claim. [2]
Solutions
That's every free question here — 4 of 79.
+75 more questions, plus Mock Papers & Worksheets, are waiting in Premium.