
Statistics: Averages and Analysis
Group data, estimate the mean, spot the modal class and solve missing-value problems with confidence
Quick facts
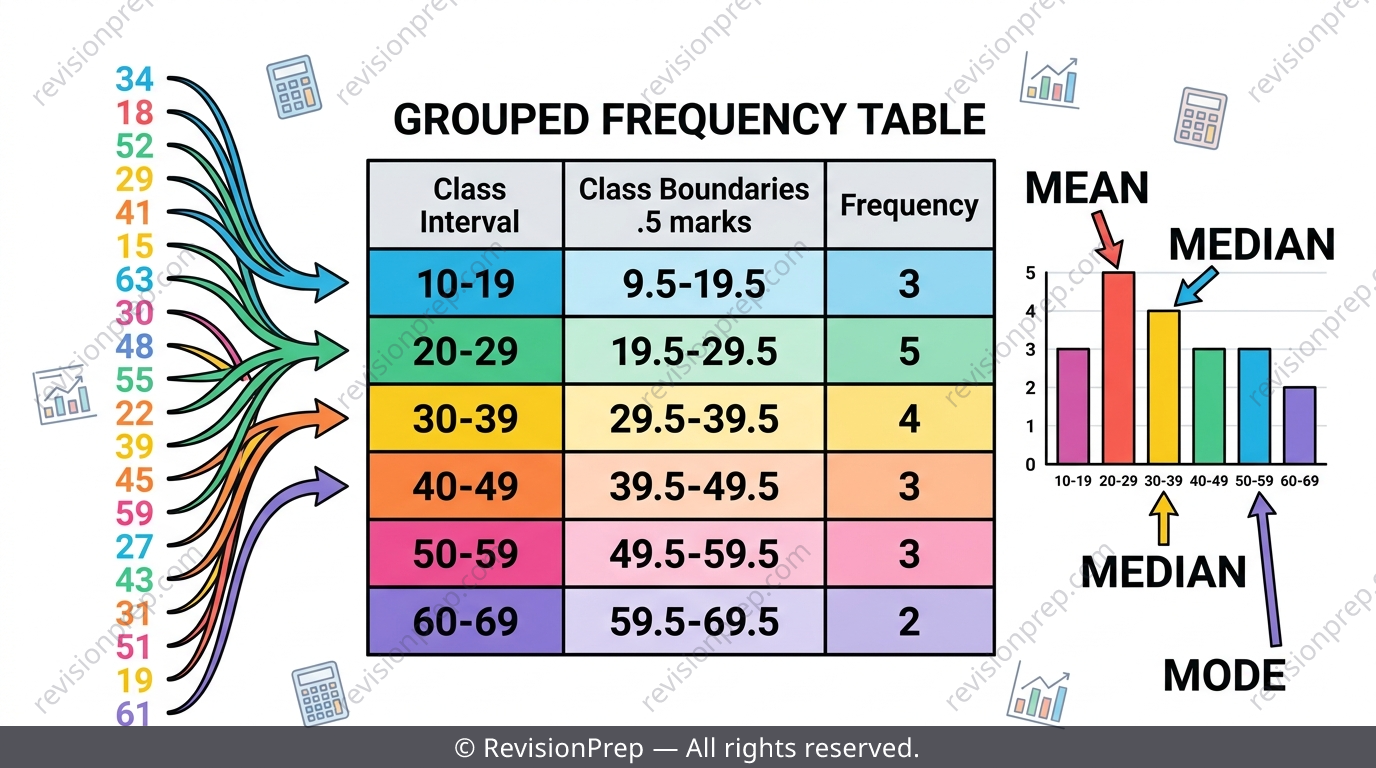
A page of 25 test scores tells you nothing at a glance — grouping it into class intervals is the first real skill in IB MYP 2 statistics, and it's where most marks are won or lost. This teaser walks through the five ideas examiners return to again and again: turning raw data into a frequency table, calculating an estimated mean using midpoints, naming the modal class, working backwards to find a missing value from a given mean, and remembering that an average alone can hide the real story about spread. Criterion D questions love asking you to compare two classes or two averages, not just calculate them — so understanding why boundaries, midpoints and totals work the way they do matters more than memorising steps. Read on for the core ideas, then head to the full revision notes for every worked example, trap, and practice set.
What you’ll be able to do
Grouping Data: Limits, Boundaries and Midpoints
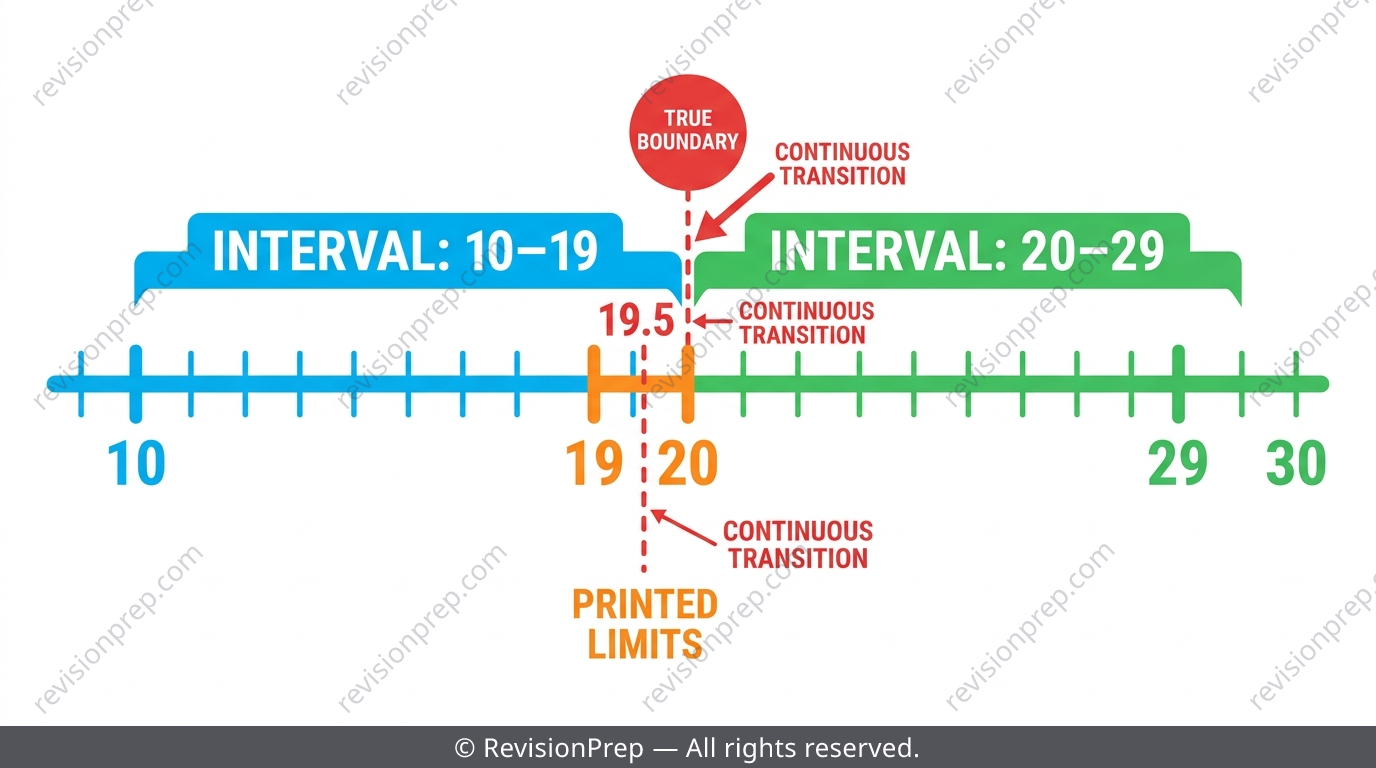
A class interval like '20–29' bundles a range of raw values into one readable row of a frequency table. The class limits (20 and 29) are just what's printed — they are NOT the true dividing points between classes. The class boundary is the real halfway line between adjacent intervals (e.g. 19.5 between '10–19' and '20–29'), and class width is always upper boundary minus lower boundary, never limit minus limit.
| Term | What it means | Example (class 20–29) |
|---|---|---|
| Class limit | The printed lower/upper number | 20 and 29 |
| Class boundary | True dividing line between classes | 19.5 and 29.5 |
| Class width | Upper boundary − lower boundary | 29.5 − 19.5 = 10 |
| Midpoint | (lower limit + upper limit) ÷ 2 | (20+29) ÷ 2 = 24.5 |
Exam tip
If asked for a boundary, give the single decimal value (e.g. 24.5), not the whole interval written back as '20–29'.
Common mistake
Writing the printed limits (20 and 29) as if they were the boundaries — boundaries almost always end in .5 for whole-number data.
Mini summary
Limits are printed numbers; boundaries are the true, usually .5, dividing lines used for width calculations.
Estimated Mean of Grouped Data
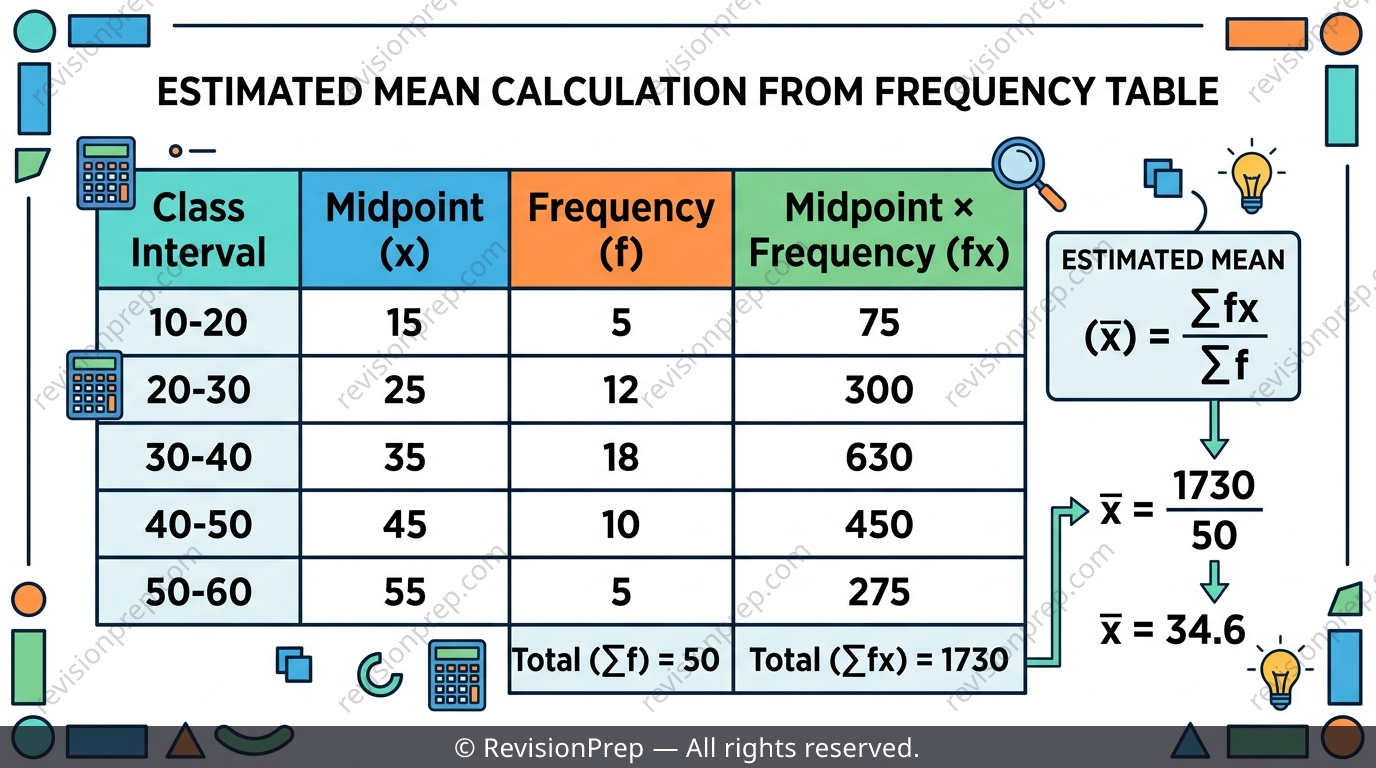
Once data is grouped, individual values are lost, so each class's midpoint stands in for every value inside it. The estimated mean is calculated as Σ(midpoint × frequency) ÷ Σfrequency — multiply each midpoint by its frequency, add these products together, then divide by the total frequency. It's called an 'estimate' because midpoints are stand-ins, not the actual recorded values.
Exam tip
Always show the final ÷ (total frequency) step in your working — students often sum the midpoint × frequency products correctly and forget to divide, losing the method mark.
Common mistake
Reporting the grouped calculation as the exact mean instead of an estimate, or forgetting the final division by total frequency.
Mini summary
Estimated mean = Σ(midpoint × frequency) ÷ Σfrequency — always divide, and always call it an estimate.
The Modal Class
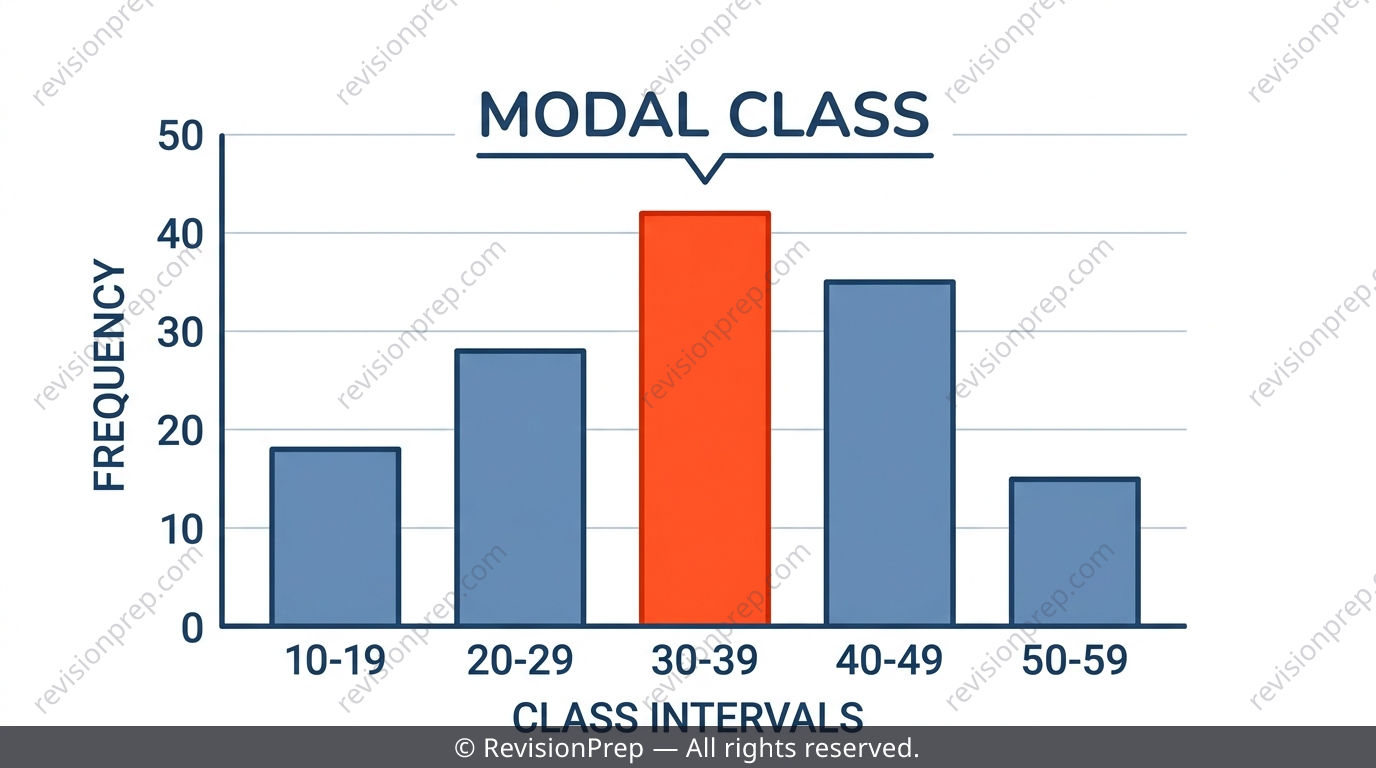
The modal class is simply the interval with the highest frequency in a grouped table. You can name the class, but you can never state one exact mode once data has been grouped — the individual values are gone, only the group frequencies remain.
Common mistake
Trying to name a single exact number as 'the mode' after data has been grouped, instead of naming the modal class as an interval.
Mini summary
Modal class = highest-frequency interval; an exact mode cannot be recovered from grouped data.
Finding a Missing Value from a Given Mean
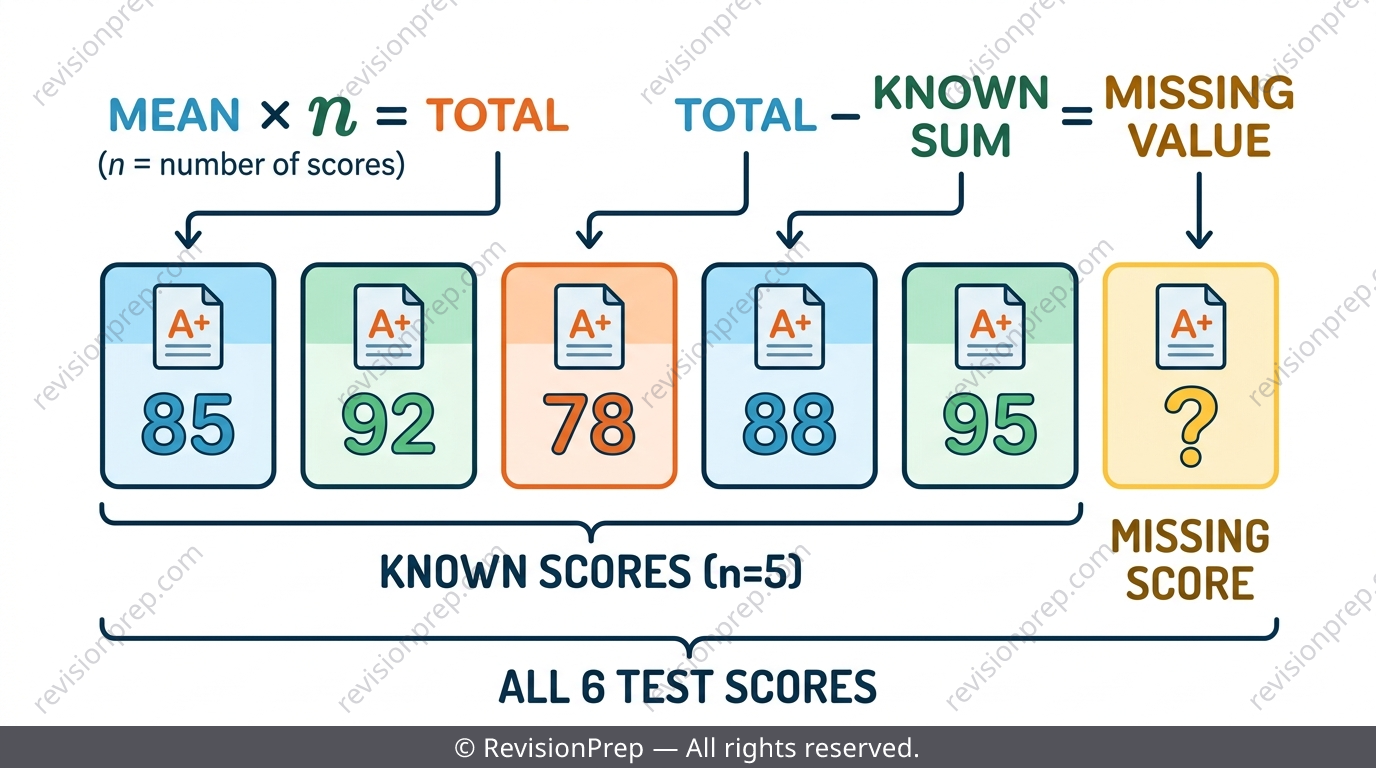
A mean secretly encodes a total: if the mean of 6 tests is 15, the sum of all 6 marks must be 15 × 6 = 90. The method is always three moves: find the total number of values (n) including the unknown, multiply n by the mean to get the required total, then subtract everything you already know — what's left is the missing value.
Exam tip
Full method marks usually require the mean × n step to be visible in your working, even if your final answer is correct.
Common mistake
Multiplying the mean by the number of KNOWN values instead of the TOTAL number of values including the unknown one.
Mini summary
Missing value = (mean × total n) − (sum of known values). Multiply once, subtract once — never average twice.
Comparing Statistics: Why Averages Alone Aren't Enough
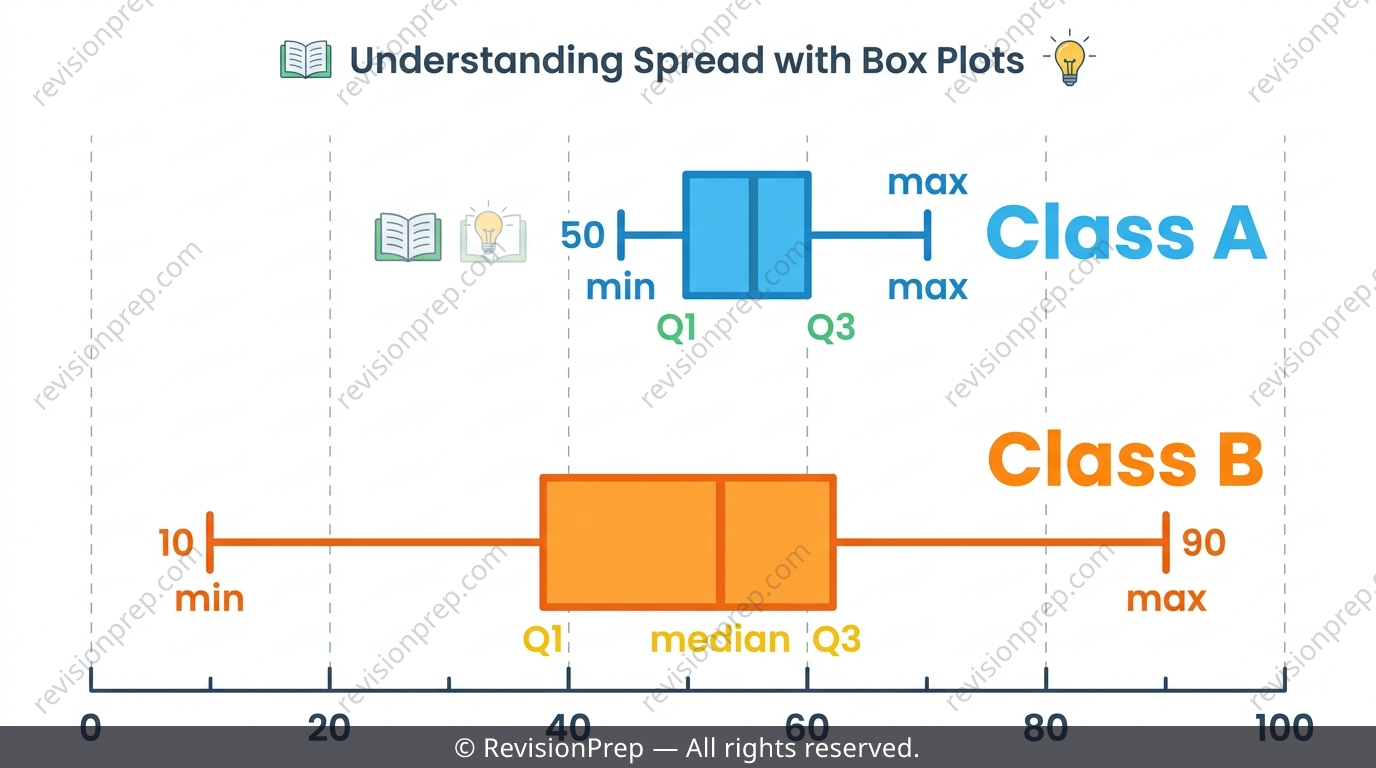
A single statistic like '23 out of 50' means nothing until compared with another value — it could be mediocre or brilliant depending on context. Two classes can share an identical median yet have very different levels of consistency, which is exactly why spread measures like box plots and IQR matter alongside averages, not instead of them.
Exam tip
When comparing two classes, always write a linking sentence (e.g. 'Class A's mean is higher, so on average Class A scored better') — stating both numbers correctly without comparing them still loses the comparison mark.
Common mistake
Stopping at 'Class A mean is 23, Class B mean is 28' with no linking sentence explaining what that difference means.
Mini summary
An average only makes sense in comparison — and spread (IQR, box plots) reveals what averages alone hide.
Quick formula sheet
Practice questions
- For the class interval 30–39, state the midpoint.
- A frequency table has intervals 0–9, 10–19, 20–29 with frequencies 3, 7, 5. Which is the modal class?
- What is the class width of the interval 40–49 if its boundaries are 39.5 and 49.5?
- The intervals 0–9, 10–19, 20–29, 30–39, 40–49 have frequencies 2, 5, 8, 4, 1. Calculate the estimated mean.
- The mean of 6 tests is 15. Five of the marks are 12, 14, 16, 18 and 20. Find the sixth mark.
- Explain, using boundaries, why the class limits 19 and 20 in adjacent intervals '10–19' and '20–29' do not leave a real gap on a continuous scale.
- Class A has an estimated mean of 23 and Class B has an estimated mean of 28, each from 20 students. Write a full comparison of the two classes.
- A dataset is grouped three different ways with 9, 5 and 2 intervals respectively. Explain which grouping is most useful for spotting a pattern, and why.
- Ages at a centre are grouped as 0–5, 6–10, 11–20, 21–30 with frequencies 8, 12, 20, 15. Explain why you cannot conclude that a wider interval always means a higher frequency.
Frequently asked questions
What's the difference between a class limit and a class boundary?+
The class limit is the number actually printed in the table (like 20 or 29), while the class boundary is the true dividing line between adjacent classes, found by taking the midpoint between them — usually ending in .5.
How do you calculate the estimated mean of grouped data?+
Multiply each class's midpoint by its frequency, add all these products together, then divide by the total frequency: Σ(midpoint × frequency) ÷ Σfrequency.
Why can't you give an exact mode once data is grouped into classes?+
Grouping loses the individual values, so you can only identify the modal class — the interval with the highest frequency — not one exact repeated number.
How do I find a missing test score if I know the mean?+
Multiply the mean by the total number of values (including the unknown) to get the required total, then subtract the sum of all known values — what's left is the missing one.
Why do class boundaries usually end in .5?+
Because boundaries sit exactly halfway between the top of one interval and the bottom of the next, and for whole-number data that midpoint calculation naturally lands on a .5 value.
Is comparing two averages enough to analyse data properly?+
No — two datasets can share the same average but have very different spreads, so measures like IQR and box plots are needed alongside averages for a full comparison.