
Chemistry Energy Profiles: Reaction Pathways and Kinetics
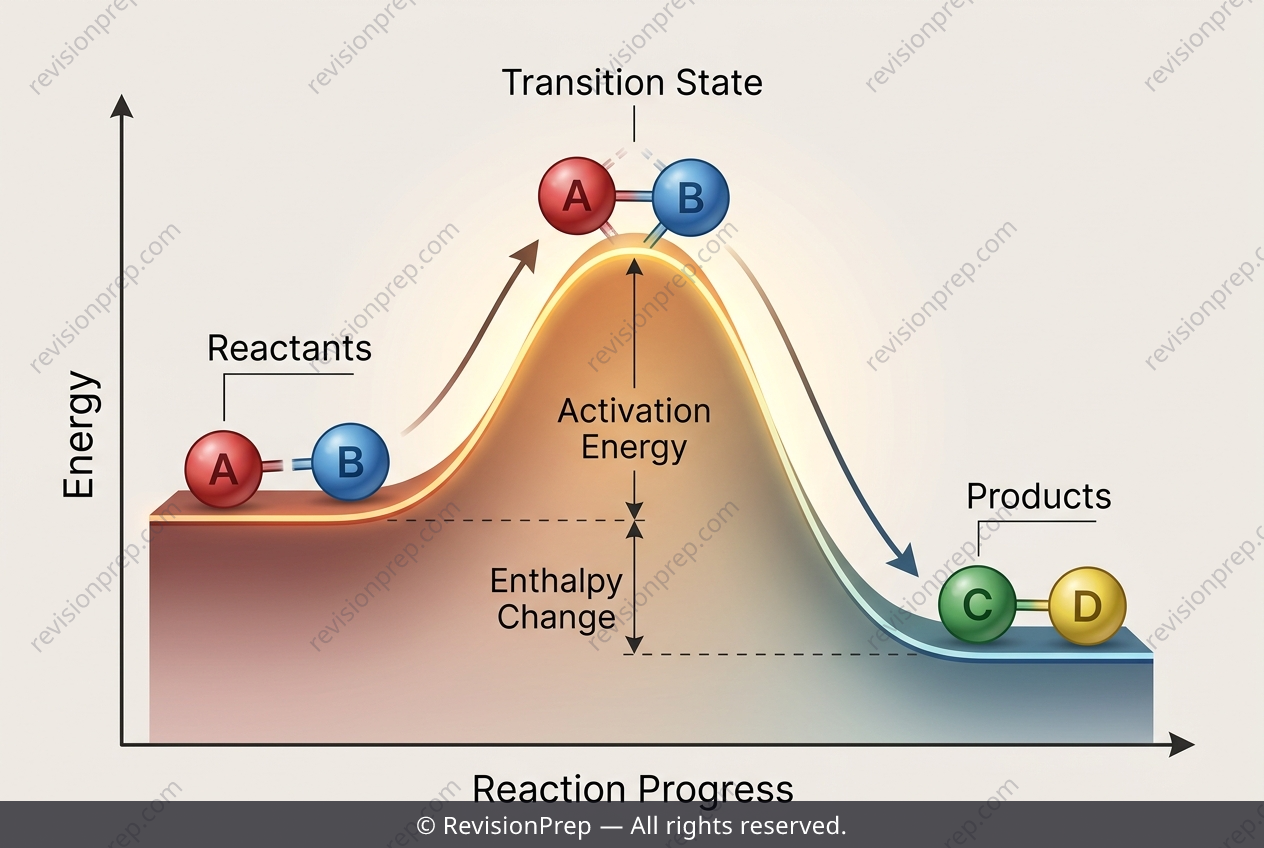
Every chemical reaction is a story of energy—one that begins with the reactants, passes through a dramatic peak, and ends with the products. In an energy profile diagram, this journey is mapped as a curve where the vertical axis represents potential energy and the horizontal axis traces the reaction’s progress. The core idea is simple: for a reaction like A + B → C + D, the total energy of the system changes as bonds break and form, and that change dictates whether the reaction releases or absorbs heat. The key landmarks on this curve are the reactants (starting energy level), the transition state (the highest-energy, unstable arrangement of atoms at the peak), and the products (final energy level). The activation energy, Ea, is the minimum energy input needed to climb from the reactants to that transition state—without it, the reaction cannot proceed. Once past the peak, energy is released as the products form. The overall enthalpy change, ΔH, is simply the difference between product and reactant energy. When the reactants sit higher than the products, ΔH is negative, meaning more energy is released during bond formation than was absorbed during bond breaking—an exothermic reaction. This interplay between Ea and ΔH explains not just whether a reaction happens, but how fast and how energetically it unfolds.
Start practising IB questions today
150,000+ IB-styled questions, criteria-mapped and instantly accessible.