
Chemistry: Heat Reshapes the Maxwell–Boltzmann Curve
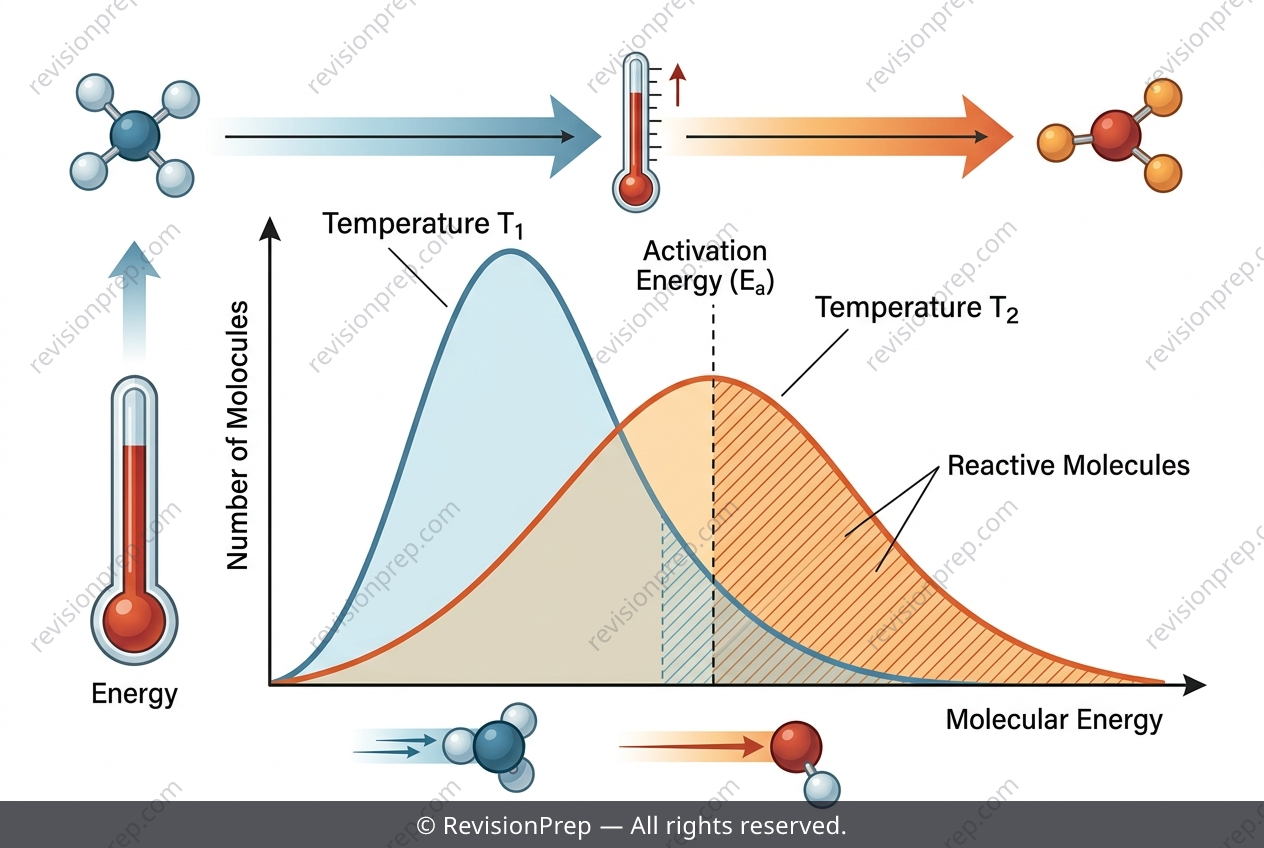
The Maxwell–Boltzmann distribution is the energy profile of a gas at a given temperature, showing how many molecules possess a particular amount of kinetic energy. Its shape is not fixed—it rises steeply, peaks, then tails off toward higher energies, with the total area under the curve representing the total number of molecules. This area remains constant regardless of temperature, but the distribution’s form changes dramatically with heating. When temperature increases from T₁ to T₂, the curve shifts to the right (higher average energy), broadens, and its peak height decreases. Crucially, the activation energy Eₐ stays fixed on the energy axis. Because the curve flattens and extends further into high-energy regions, the shaded area representing molecules with energy ≥ Eₐ grows larger—even though the total area under the curve is unchanged. This explains why reaction rates accelerate with temperature: a greater fraction of collisions now possess enough energy to overcome the activation barrier. Understanding this shift is fundamental to predicting how fast reactions proceed under different thermal conditions.
Start practising IB questions today
150,000+ IB-styled questions, criteria-mapped and instantly accessible.