
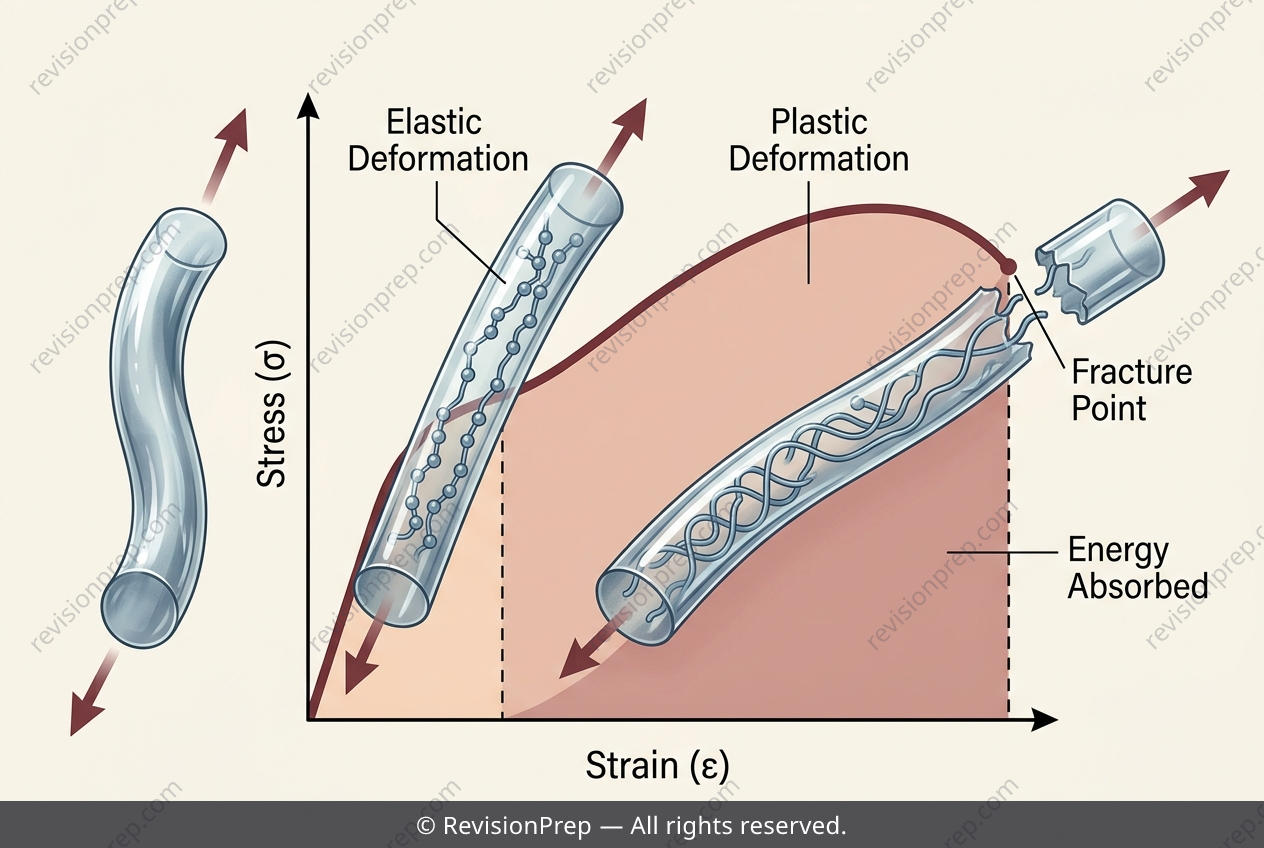
Chemistry: The Area Under the Curve Measures Toughness
When a material is pulled, bent, or compressed, its response is captured by a stress–strain curve—a graph that plots the force per unit area (stress) against the fractional change in length (strain). This curve is the mechanical fingerprint of a substance, revealing how it deforms elastically (reversibly) at first, then plastically (permanently) before eventual failure. For materials like polymers, the shape of this curve dictates real-world performance, from surgical sutures that must stretch without snapping to structural beams that must absorb impacts. The key to interpreting this curve lies in the area beneath it. While the initial linear slope gives Young’s modulus (stiffness) and the departure from linearity marks yield strength, the total area under the curve—from the origin all the way to the breaking point—represents something more holistic: toughness. This quantity measures the energy absorbed per unit volume of material up to fracture, integrating both the elastic and plastic deformation regions. A large plastic region, as seen in ductile polymers, means the material can soak up substantial energy before failing, making toughness a critical design parameter for applications requiring resilience against sudden or sustained loads.
Start practising IB questions today
150,000+ IB-styled questions, criteria-mapped and instantly accessible.