
Maths: A z-Test for a Plant's Mean Height
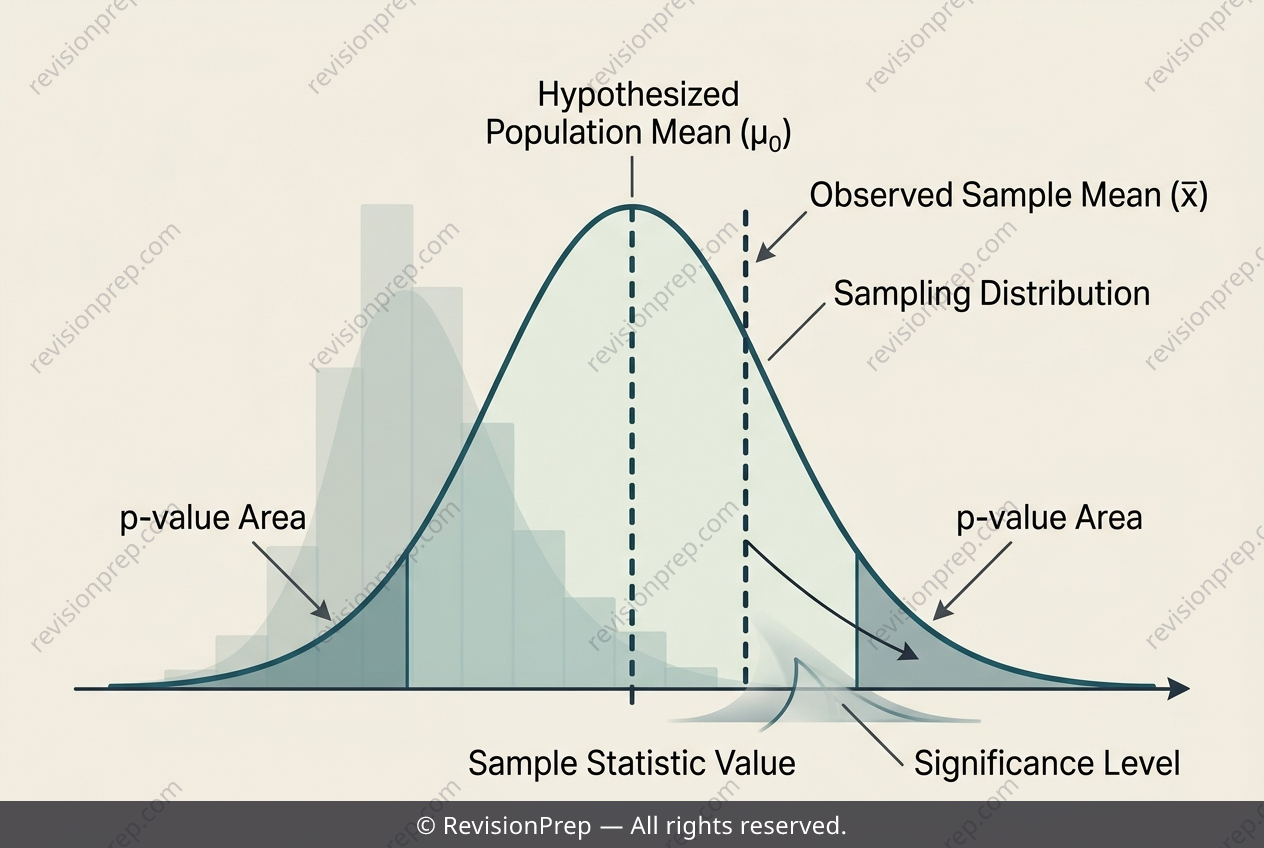
Hypothesis testing is the statistical equivalent of a courtroom trial: you assume a claim is true until the evidence says otherwise. In this case, the claim is that the mean height of a plant species is 45 cm, and a sample of 12 plants gives a mean of 43.2 cm. The core question is whether this sample result is just random chance or a genuine sign that the true mean is different. The machinery behind this decision is the z-test for a population mean, used when the population standard deviation is known. You compare the observed sample mean to the claimed mean, scaled by the standard error (σ/√n), producing a z-score. For a two-tailed test, the p-value is the probability of seeing a z-score at least as extreme as yours, in either direction—so you double the one-tailed probability. The p-value is then weighed against the significance level (here, 5%). If the p-value is larger than that threshold, you lack sufficient evidence to reject the null hypothesis, meaning the sample is consistent with the claim. This process connects the sample, the known population spread, and the chosen risk of error into a single, interpretable verdict.
Start practising IB questions today
150,000+ IB-styled questions, criteria-mapped and instantly accessible.