
Maths: Fitting a Quadratic to Sprint Times
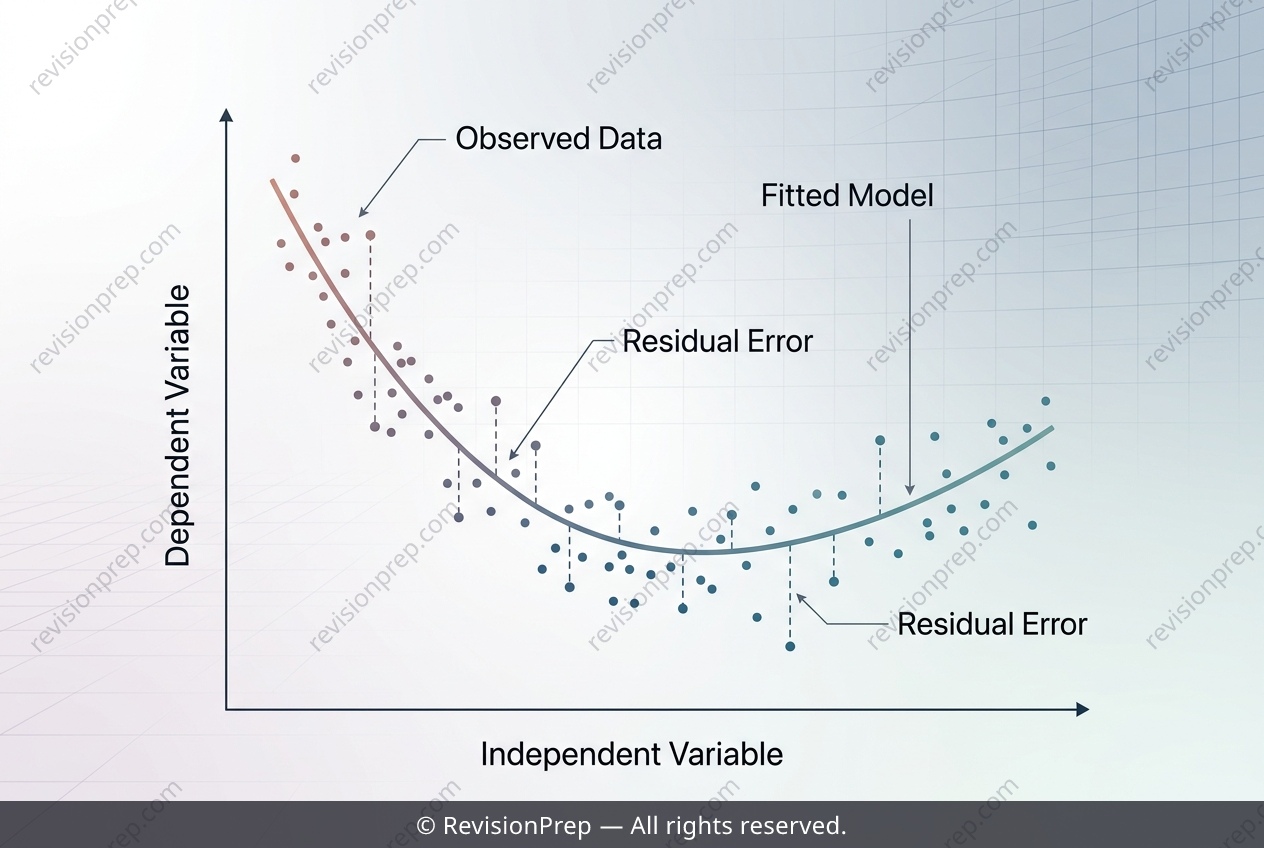
Regression analysis is the mathematical art of finding a curve that best describes the relationship between two variables—here, how weekly training hours (h) influence 100‑metre sprint times (t). Rather than assuming a straight line, a quadratic model of the form t = ph² + qh + r allows for curvature, capturing situations where performance improves rapidly at first, then plateaus or even declines with overtraining. This is the core idea: we use a set of observed data points to estimate the coefficients p, q, and r, which together define the shape of the parabola that minimises the overall distance between the model’s predictions and the actual measurements. Why does this matter? Because a well‑fitted model lets us predict outcomes for unseen values of h—like estimating a sprinter’s time for 11 hours of training—and, crucially, evaluate how trustworthy that prediction is. The key mechanism is residual analysis: the difference between each observed time and the value the model predicts. Small, randomly scattered residuals indicate a good fit; large or patterned residuals reveal that the quadratic is inappropriate. In this example, the coefficients must be chosen so that the model’s curve genuinely follows the data’s trend—not just at a few points, but across the entire range. Understanding how p, q, and r interact with the residuals is what separates a useful model from a misleading one.
Start practising IB questions today
150,000+ IB-styled questions, criteria-mapped and instantly accessible.