
Maths: From Histogram to Conditional Probability
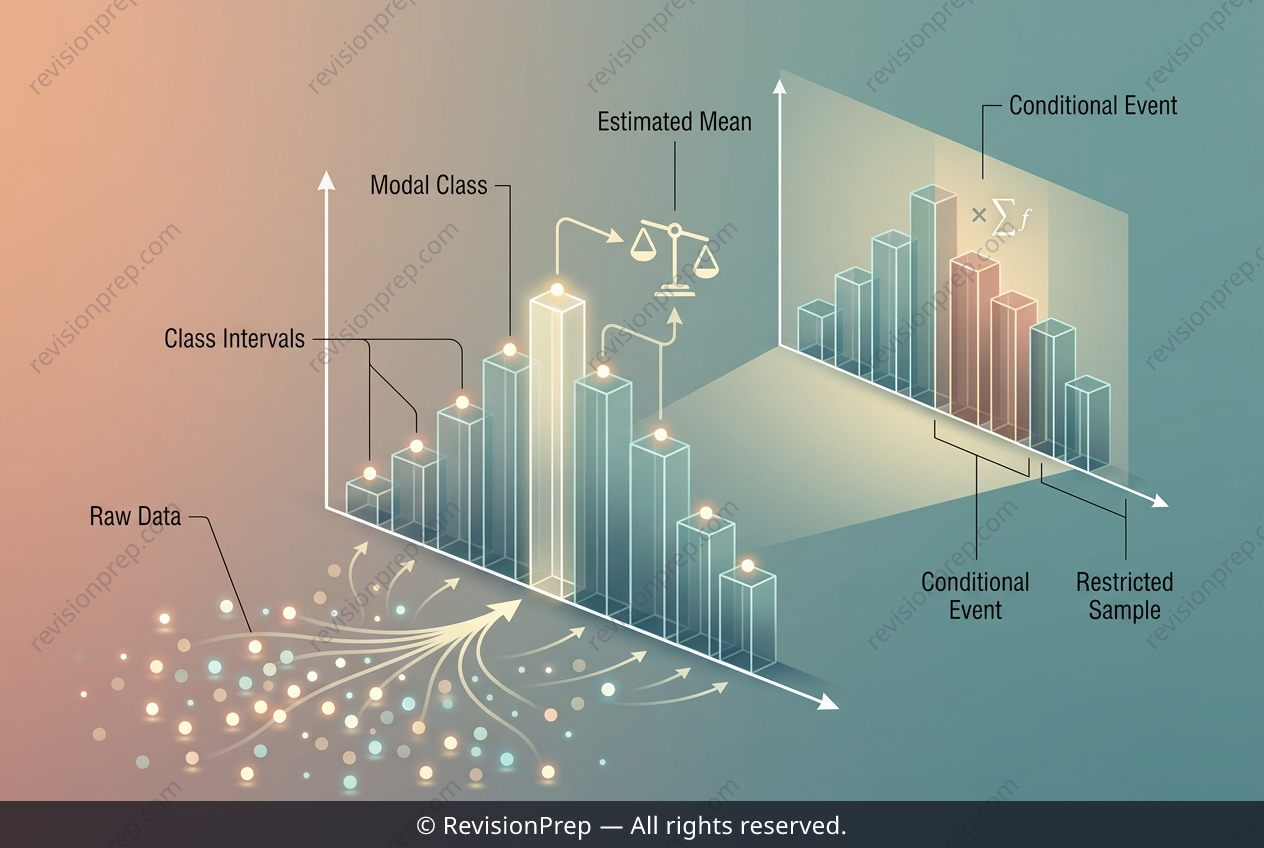
Descriptive statistics and conditional probability often feel like separate topics, but in the IB Maths AI SL course, they frequently appear together in a single, layered problem. At its heart, this question asks you to summarise a dataset using its histogram, then to zoom in on a specific subset of that data to calculate a new probability. The core idea is that a histogram is not just a picture—it is a source of numerical information, where the frequency of each class interval can be used to estimate central tendencies and to define the sample space for further calculations. The key relationship here is the formula for the estimated mean, x̄ = Σfx / Σf, where f is the frequency and x is the midpoint of each class. This formula connects the visual shape of the distribution to a single numerical summary. Once you have that mean, you can then shift your perspective: instead of asking about all 80 students, you restrict your attention to those who scored at least 40. This new condition changes the denominator of your probability, turning a global summary into a conditional one. The modal class, meanwhile, simply identifies the interval with the highest bar, giving you a quick sense of where most scores cluster. Together, these three parts show how one dataset can be examined from different angles—first by its overall shape, then by its average, and finally by a probability that depends on a specific filter.
Start practising IB questions today
150,000+ IB-styled questions, criteria-mapped and instantly accessible.