
Maths: From z-Scores to Standard Error
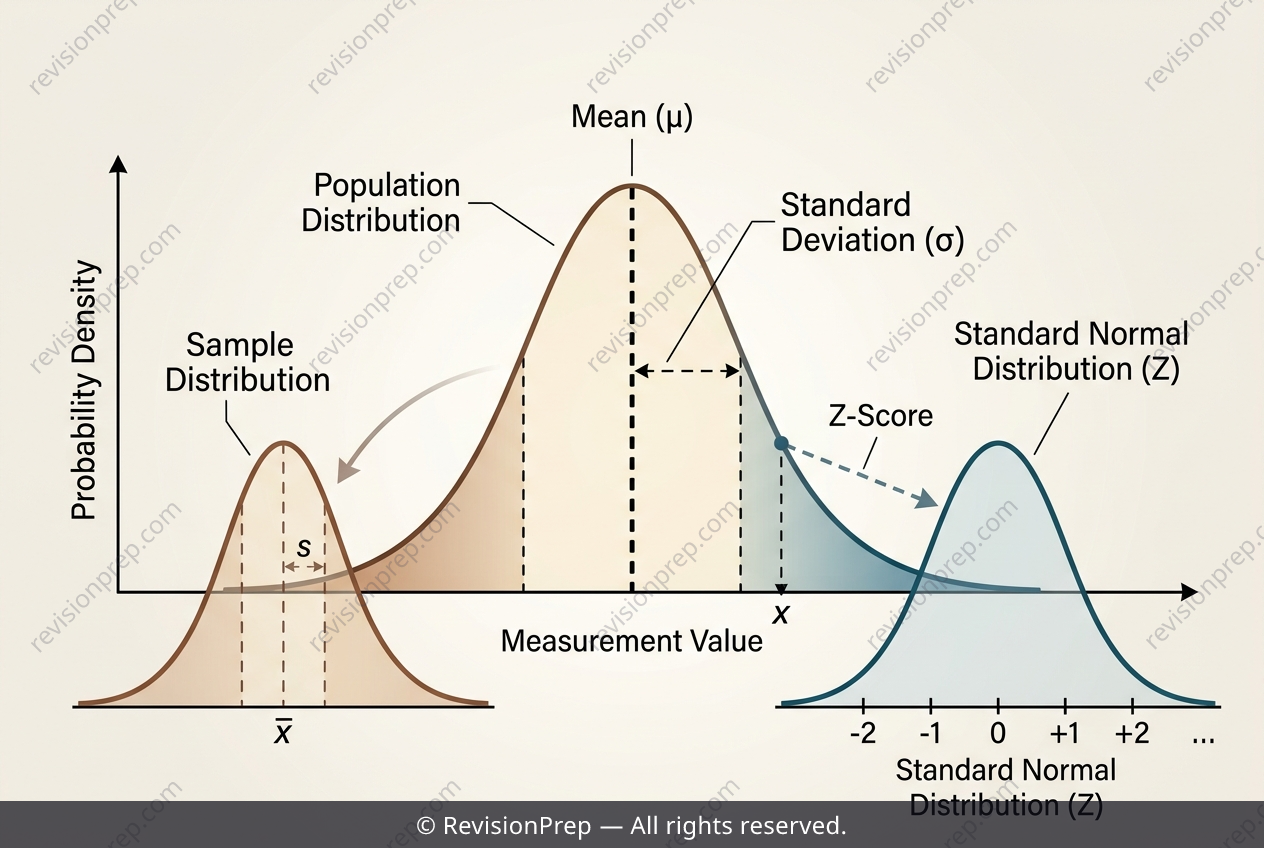
The normal distribution is the statistical workhorse of the natural sciences, and for IB Maths AI SL, it’s the bridge between raw data and meaningful inference. When a variable like mussel shell length is normally distributed, we can use its mean (μ) and standard deviation (σ) to predict probabilities and standardise any observation into a z-score: z = (x − μ) / σ. This transformation is powerful because it lets us compare individual measurements to the whole population, and it underpins everything from checking a claim about the top 10% of shells to interpreting a single extreme sample value. But the normal distribution isn’t just about single points—it also explains how samples behave. When you collect a sample of size n, the sample mean (x̄) has its own normal distribution with a smaller spread, called the standard error (σ/√n). This is why a sample mean of 46.3 mm or a sample standard deviation of 7.4 mm can be perfectly consistent with a population mean of 45 mm and σ = 8 mm: the gap between sample and population is measured in standard errors, not raw millimetres. By connecting z-scores, standard errors, and sampling variability, you move from describing a fixed population to judging whether observed data plausibly came from it—the essence of statistical inference.
Start practising IB questions today
150,000+ IB-styled questions, criteria-mapped and instantly accessible.