
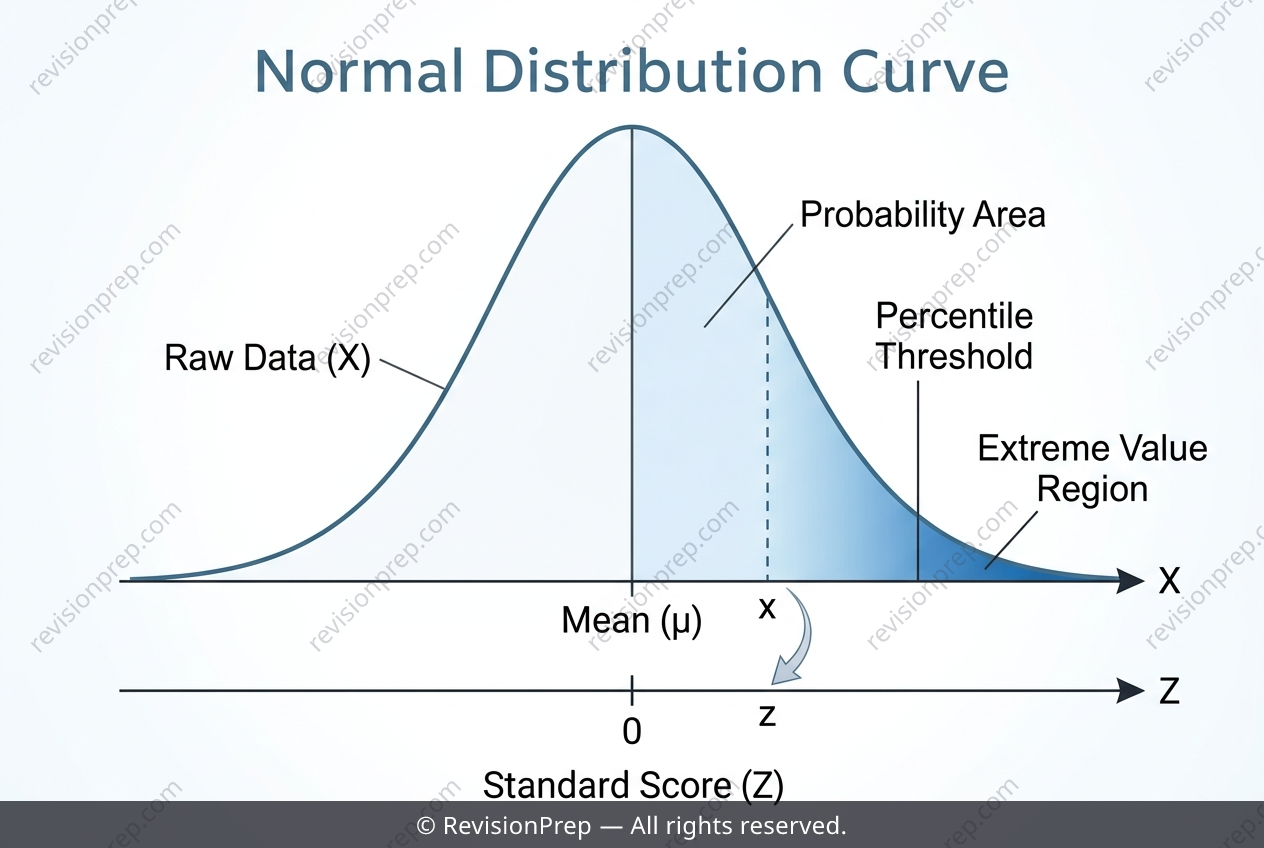
Maths: Giraffe Heights and the Normal Curve
The normal distribution is the statistical model of choice when data clusters symmetrically around a central value, with most observations falling close to the mean and fewer appearing in the tails. In this context, the heights of adult female giraffes follow such a pattern, defined by a mean and a standard deviation. The key mechanism for standardising any individual measurement is the z-score, calculated as z = (x − μ) / σ. This transformation tells you how many standard deviations a particular height sits above or below the average, converting the original scale into a universal standard normal scale. Why does this matter? Because once you have a z-score, you can move seamlessly between raw values, probabilities, and percentiles. For instance, finding the probability of a giraffe being taller than a given height means computing the area under the curve to the right of that z-score. Conversely, if you need to find the height that cuts off the top 10% of the population, you reverse the process: locate the z-score corresponding to a cumulative probability of 0.90, then convert back using x = μ + z·σ. This interplay between raw data, standardised scores, and tail probabilities is the heart of normal distribution analysis—allowing you to answer both “how unusual is this?” and “what value marks a certain threshold?” in one coherent framework.
Start practising IB questions today
150,000+ IB-styled questions, criteria-mapped and instantly accessible.