
Maths: One Interval, Two Statistical Questions
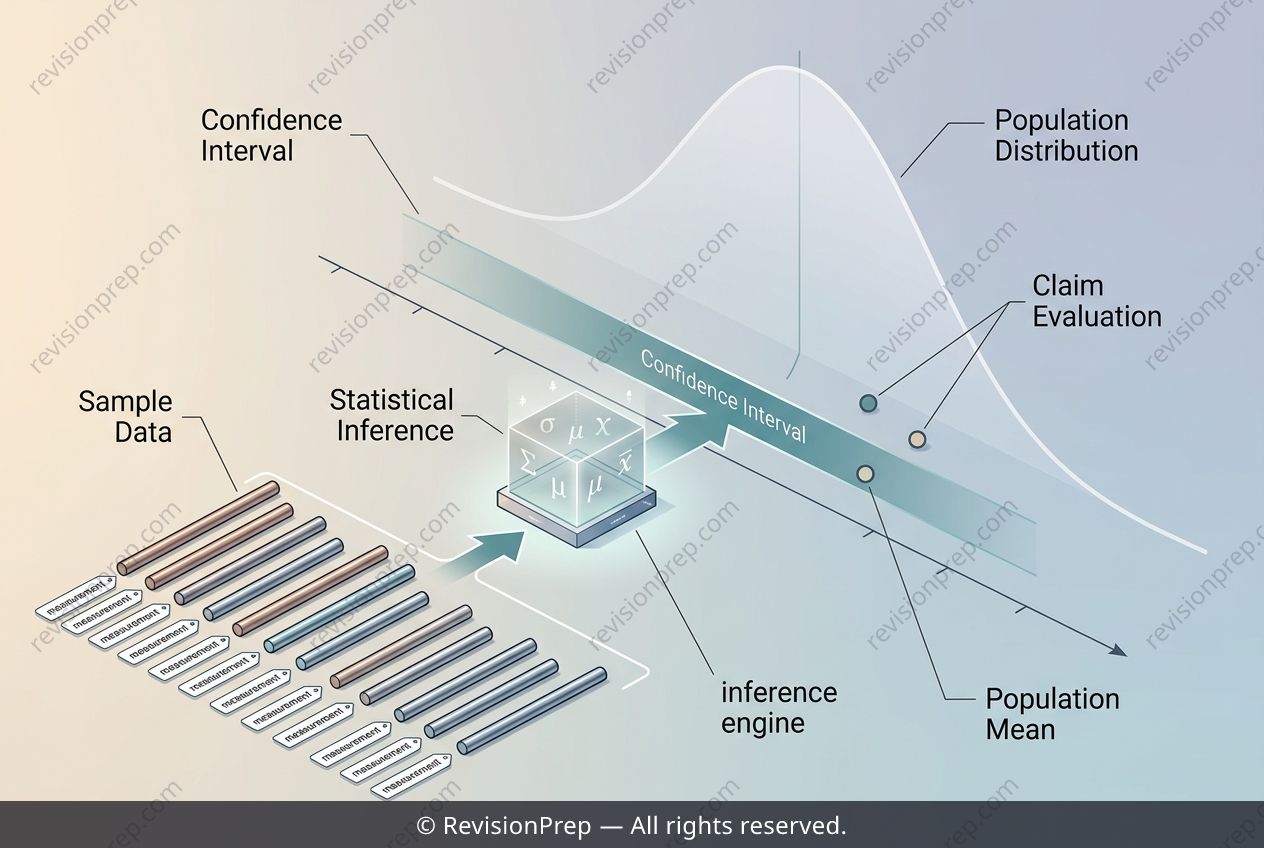
Statistical inference is the art of drawing conclusions about a large population from a small, imperfect sample. In this case, we have a factory’s metal rods, where the true mean length is unknown, and we must decide whether the manager’s claim of 150 mm holds up against the evidence from just 12 measured rods. The core tool here is the confidence interval: a range of plausible values for the population mean, built from the sample mean (x̄ = 150.52 mm), the sample standard deviation (s = 0.923 mm), and the sample size (n = 12). Because the sample is small and the population standard deviation is unknown, we use the t-distribution with n − 1 = 11 degrees of freedom, giving a critical value of t₁₁ = 2.201 for 95% confidence. The interval is calculated as x̄ ± t₁₁ · (s / √n), where the margin of error (≈ 0.586 mm) captures sampling uncertainty. This interval then becomes the bridge to hypothesis testing: if a claimed value (like 150 mm) falls inside the interval, we lack evidence to reject it; if a claim (like μ ≤ 151 mm) is contradicted by the upper bound exceeding 151, the data do not fully support it. Understanding this connection—how a single interval can simultaneously estimate a parameter and test competing claims—is the heart of statistical inference, and it’s what turns raw measurements into defensible business decisions.
Start practising IB questions today
150,000+ IB-styled questions, criteria-mapped and instantly accessible.