
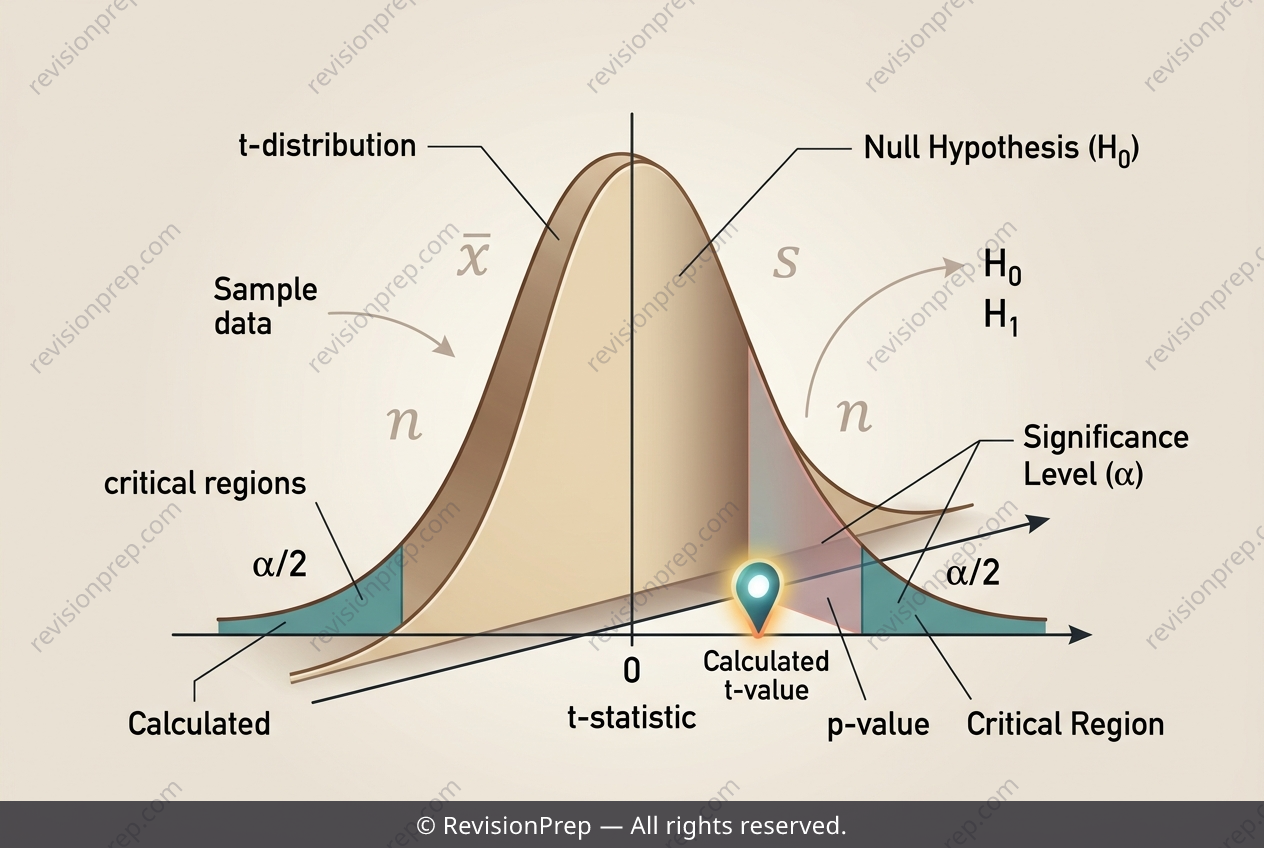
Maths: t-Test for the Mean Height of 8 Sunflowers
Hypothesis testing is the statistical tool we use to decide whether a claim about a population is supported by the data we actually collected. When the population standard deviation is unknown—which is almost always the case in real biological or social science studies—we turn to the t-test. This test uses the sample’s own standard deviation as an estimate, and the resulting test statistic follows a t-distribution, which accounts for the extra uncertainty that comes from small sample sizes. In this context, the core idea is to compare a sample mean (here, from 8 sunflower plants) against a hypothesized population mean (50 cm). The null hypothesis, H₀, states that the true mean equals 50, while the alternative, H₁, claims it differs (a two-tailed test). To make this comparison, we calculate the t-statistic using the formula t = (x̄ − μ) / (s / √n), where x̄ is the sample mean, s is the sample standard deviation, and n is the sample size. The p-value then tells us the probability of observing a t-value this extreme if H₀ were true. By comparing that p-value to the significance level (0.05), we decide whether the evidence is strong enough to reject H₀—or whether the observed difference is just due to random chance.
Start practising IB questions today
150,000+ IB-styled questions, criteria-mapped and instantly accessible.