
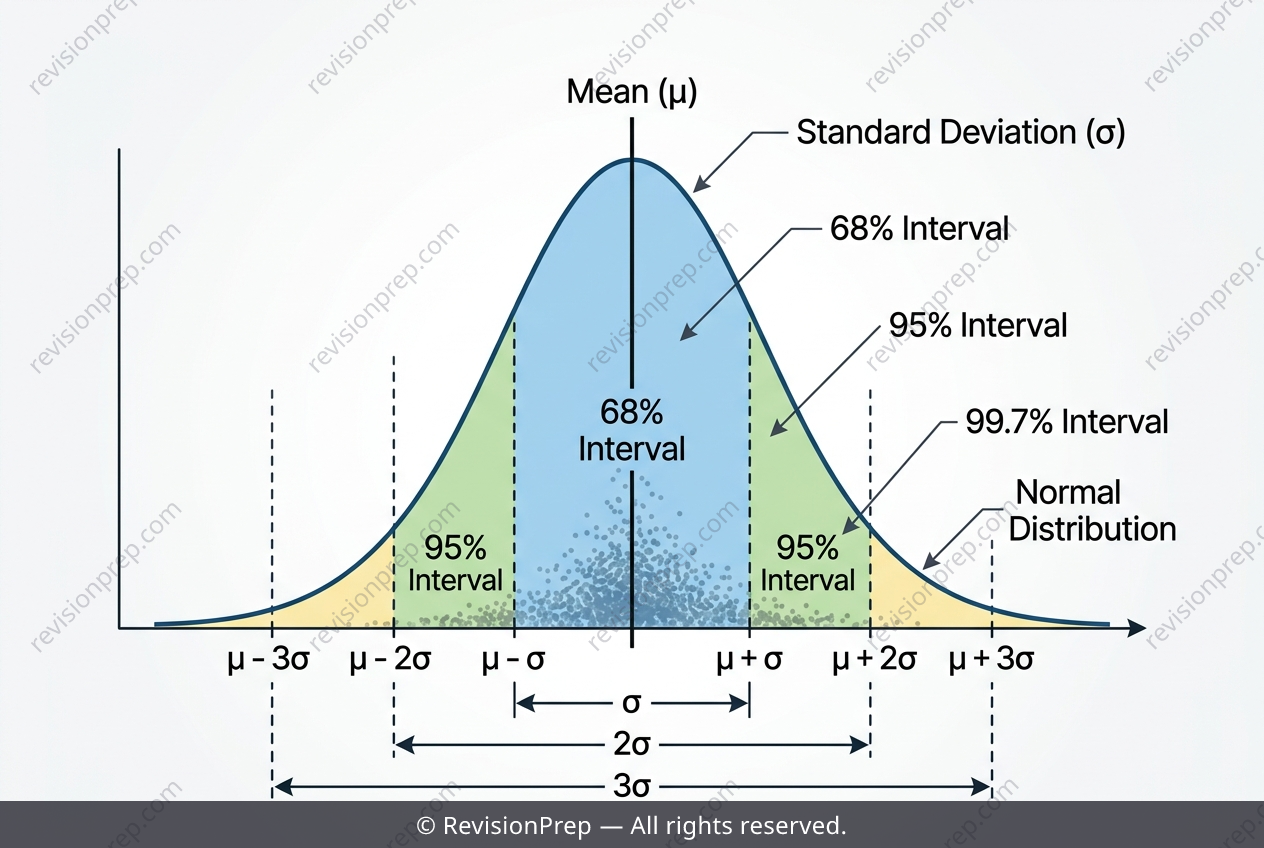
Maths: The 68–95–99.7 Rule on the Normal Curve
The Empirical Rule—often called the 68-95-99.7 rule—is a shortcut for understanding any normal distribution without crunching integrals. It tells you that for a bell-shaped curve, roughly 68% of all data lies within one standard deviation of the mean, 95% within two, and 99.7% within three. In this topic, you’ll see how that rule translates directly into probability statements about a continuous random variable, such as adult female heights in a city. The key move is standardisation: converting any normal variable X with mean μ and standard deviation σ into the standard normal Z using Z = (X − μ)/σ. Here, the interval from 159 cm to 171 cm sits exactly one standard deviation (6 cm) below and above the mean of 165 cm, so the probability of falling inside that range is the same as P(−1 < Z < 1). That single connection—between raw data limits and Z-scores—is what makes the rule so powerful. Once you grasp that, finding the probability of being outside the interval is simply the complement: 1 minus the inside probability, a relationship that holds for any normal distribution.
Start practising IB questions today
150,000+ IB-styled questions, criteria-mapped and instantly accessible.