
Maths: Two-Tailed t-Test — Is the Mean Different?
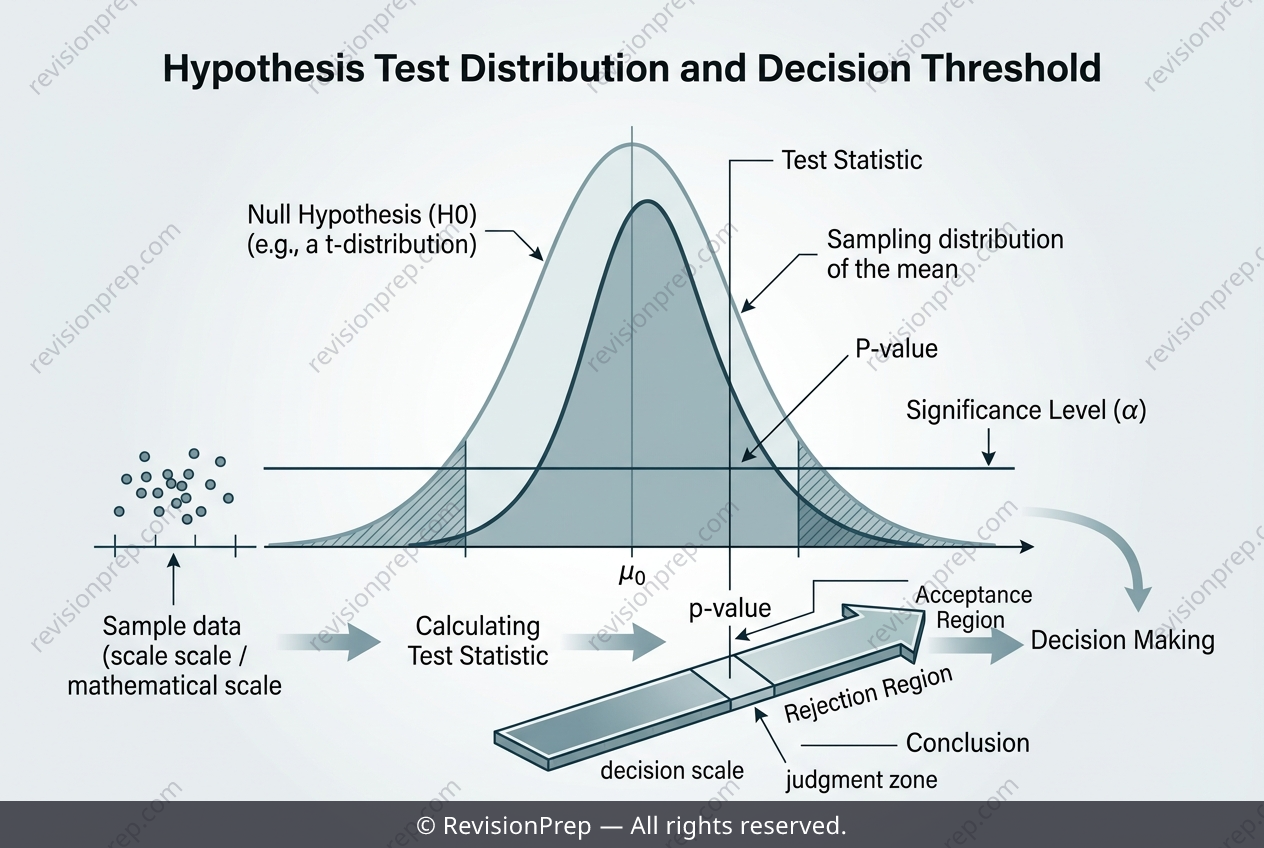
Hypothesis testing is the statistical tool we use to decide whether a pattern in data is real or just due to random chance. In this context, a biologist has a known historical mean mass for a bird species, and wants to know if the current population’s mean has shifted. The core idea is to set up two competing claims: a null hypothesis (H₀) that assumes no change, and an alternative hypothesis (H₁) that suggests a difference. For a two-tailed test, H₁ is written as μ ≠ 85, meaning we are open to a change in either direction. The mechanism relies on the one-sample t-test, which compares the sample mean to the hypothesised population mean while accounting for sample variability. You calculate the test statistic as t = (x̄ − μ) / (s / √n), where x̄ is the sample mean, s is the sample standard deviation, and n is the sample size. This t-value is then converted into a p-value, which represents the probability of observing your sample results (or more extreme) if H₀ were true. The decision rule is simple: if the p-value is greater than the significance level (α = 0.05), you do not reject H₀. This means the evidence is insufficient to claim the mean mass has changed—even if the sample mean looks slightly different from 85 grams. Understanding this link between the t-statistic, p-value, and conclusion is the heart of statistical inference.
Start practising IB questions today
150,000+ IB-styled questions, criteria-mapped and instantly accessible.