
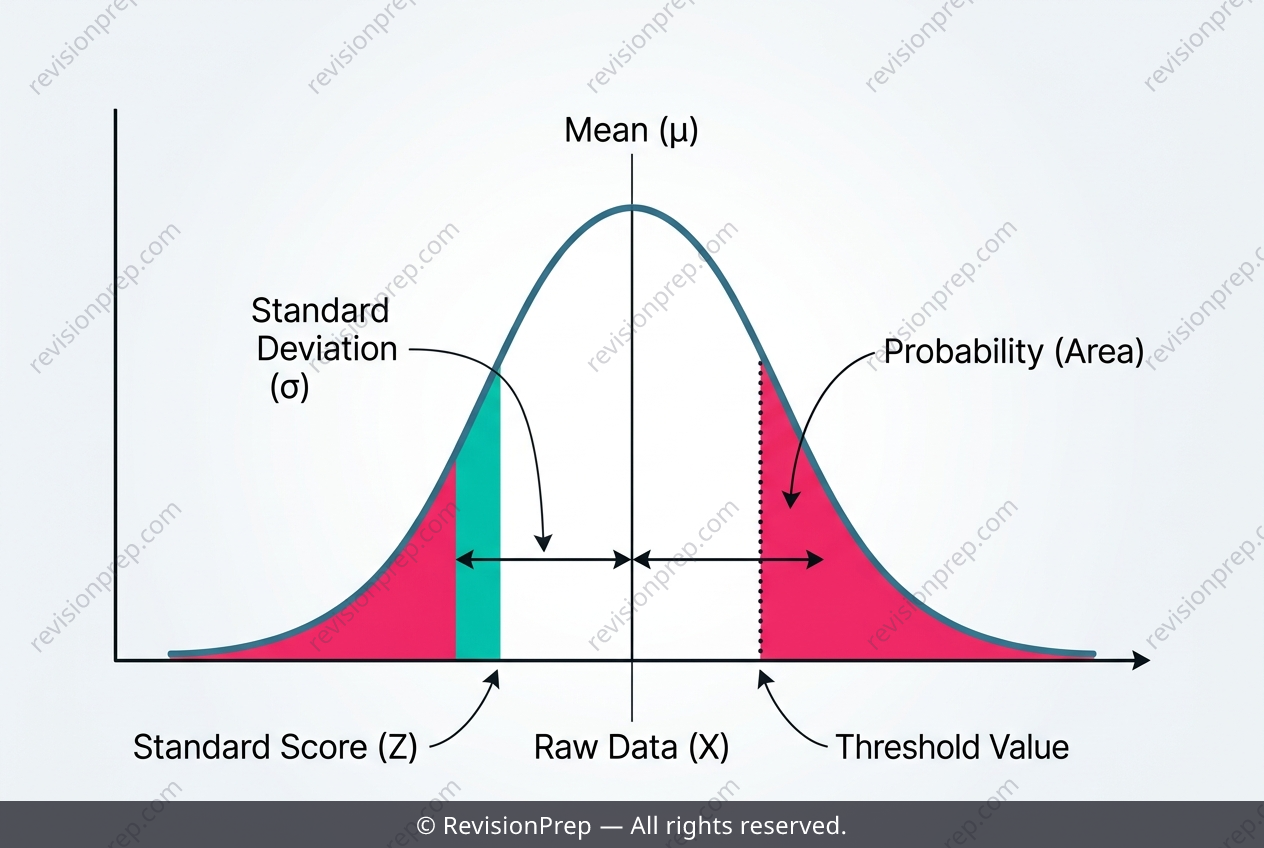
Maths: Two-Way Reasoning with the Normal Curve
Normal distribution analysis is the statistical tool used to understand how data spreads symmetrically around a central mean, with most values clustering near the average and fewer appearing at the extremes. In the context of Maths AI SL, this concept lets you move from raw measurements—like student heights—to probabilities and thresholds, bridging the gap between raw data and real-world decisions. The power of the normal model lies in its standard deviation, which defines the curve’s width. By converting any raw value into a z-score using z = (x − μ)/σ, you can locate that value on the standard normal curve and calculate the probability of observing something more extreme. Conversely, when you know a desired probability—say, the top 10% of a population—you reverse the process using the inverse normal function, finding the raw x that corresponds to that cutoff. This two-way reasoning is central to the topic: one direction asks “how likely is this value?” while the other asks “what value marks this likelihood?” The mean and standard deviation anchor every calculation, making the normal distribution a flexible model for everything from test scores to biological traits.
Start practising IB questions today
150,000+ IB-styled questions, criteria-mapped and instantly accessible.