
Maths: Type I vs Type II — Which Error Matters More?
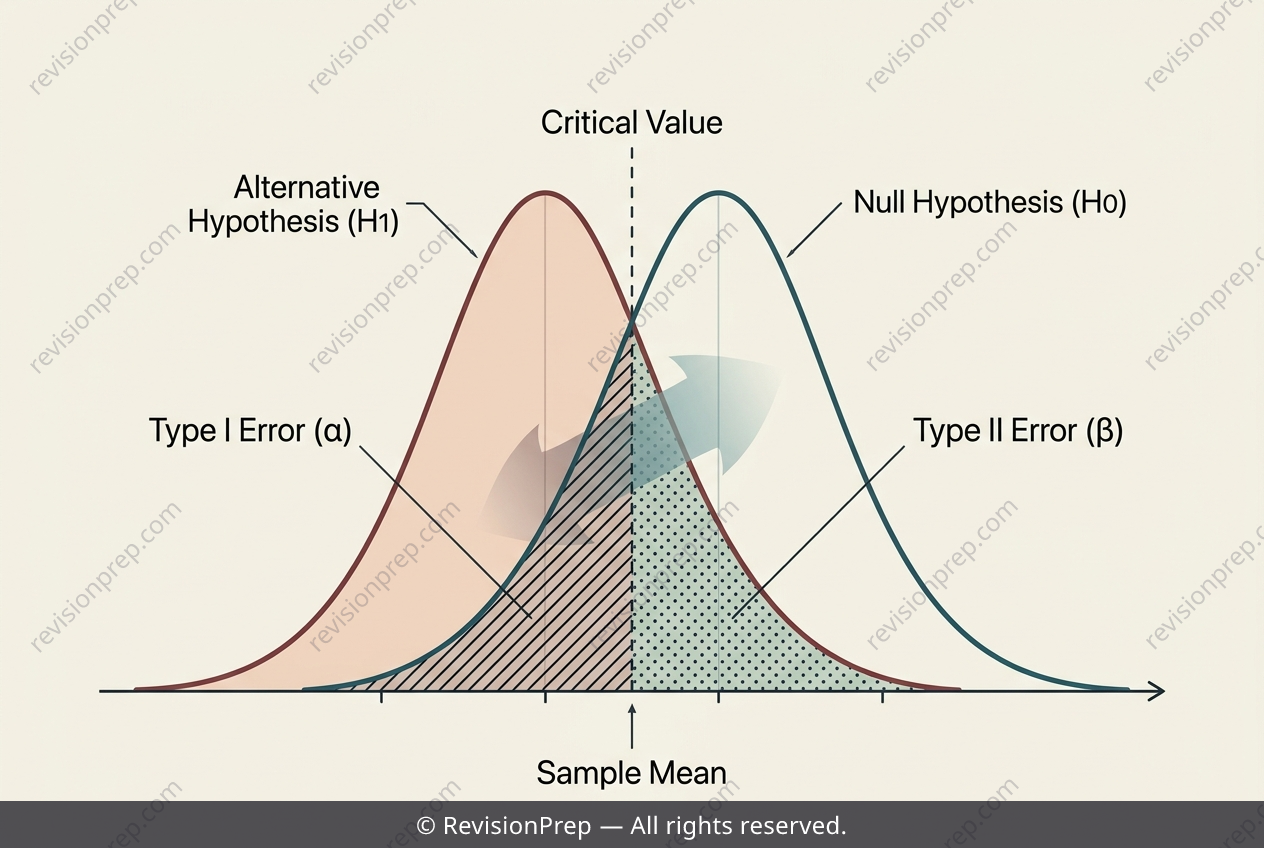
Hypothesis testing is fundamentally about making decisions under uncertainty, and the balance between two specific risks lies at its heart. When a biologist tests whether a new regulation has reduced a pollutant’s mean concentration, she must first define a rejection region for the sample mean. This region is set by the significance level—here, 1%—which determines a critical value using the known population standard deviation and sample size. The core concept is the trade-off between Type I error (rejecting a true null hypothesis) and Type II error (failing to reject a false null hypothesis). The mechanics reveal an inverse relationship: as the significance level increases from 1% to 5%, the critical value shifts toward the original mean, making the rejection region larger. This larger region makes it easier to detect a true decrease (lowering Type II error, β), but it simultaneously raises the probability of a false alarm (increasing Type I error). The Type II error is calculated by standardising the distance between the critical value and the true alternative mean, then finding the tail probability. Understanding this dynamic tension is essential for interpreting any statistical conclusion—no test can minimise both errors at once, so the chosen significance level reflects the relative cost of each mistake.
Start practising IB questions today
150,000+ IB-styled questions, criteria-mapped and instantly accessible.