
Maths: Welch's t-Test — Real Difference or Chance?
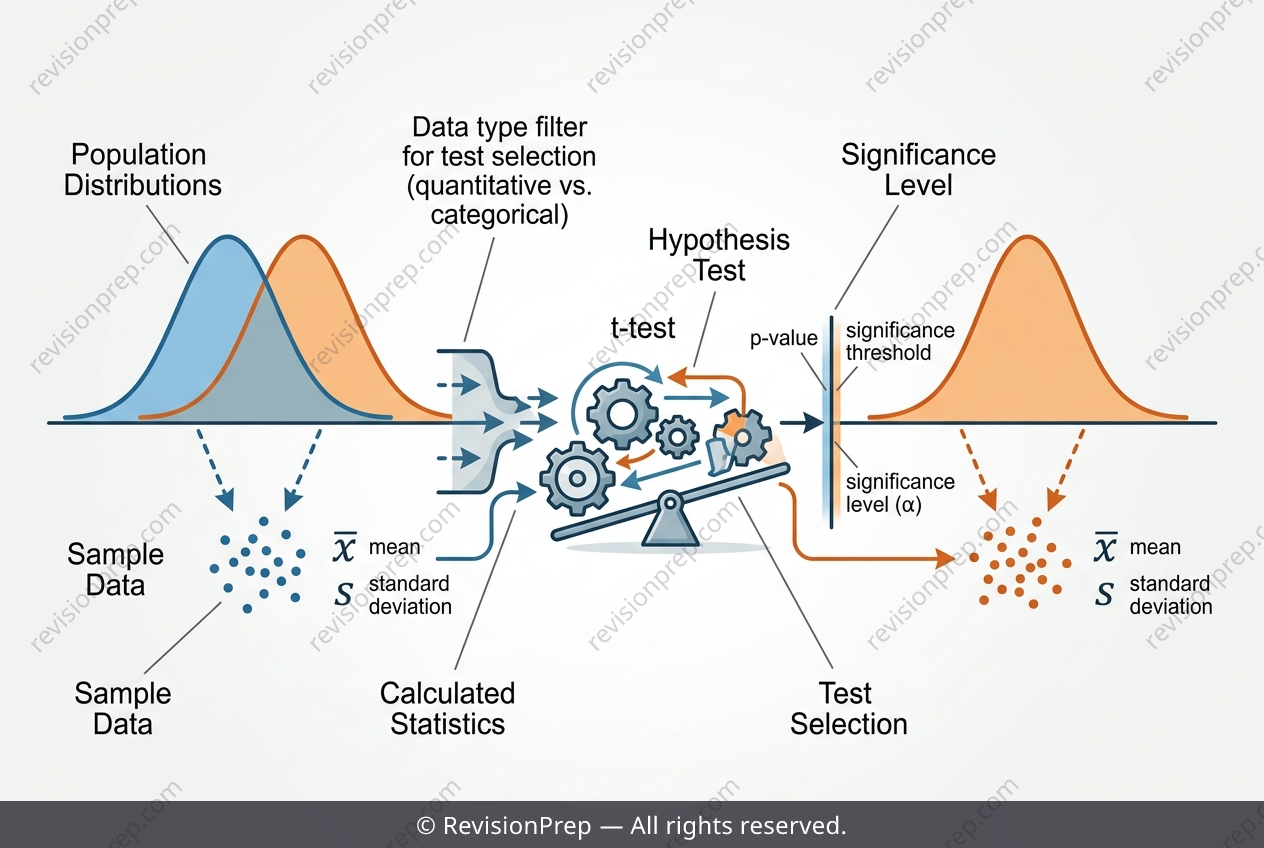
When two teaching methods produce different average scores, how do we know the difference is real and not just random chance? This is the core question of inferential statistics, and hypothesis testing for means provides the formal answer. In this context, we compare two independent samples using a two-sample t-test, specifically Welch’s test, which does not assume equal population variances. The test statistic combines the difference in sample means with the variability (standard deviations) and sample sizes of each group, producing a t-value that measures how many standard errors the means are apart. The degrees of freedom, here taken as the smaller of n₁ − 1 and n₂ − 1, determine the shape of the t-distribution used to find the p-value. A small p-value (below a chosen significance level) leads us to reject the null hypothesis that the true means are equal. Crucially, the choice of test depends on data conditions—for instance, a chi-squared test would be invalid if any expected frequency is zero, as seen when a category has no observations. Understanding these connections—between means, spread, sample size, and test assumptions—lets you decide which statistical tool fits the data and interpret the strength of evidence correctly.
Start practising IB questions today
150,000+ IB-styled questions, criteria-mapped and instantly accessible.