
Maths: z-Intervals and the 5% Significance Level
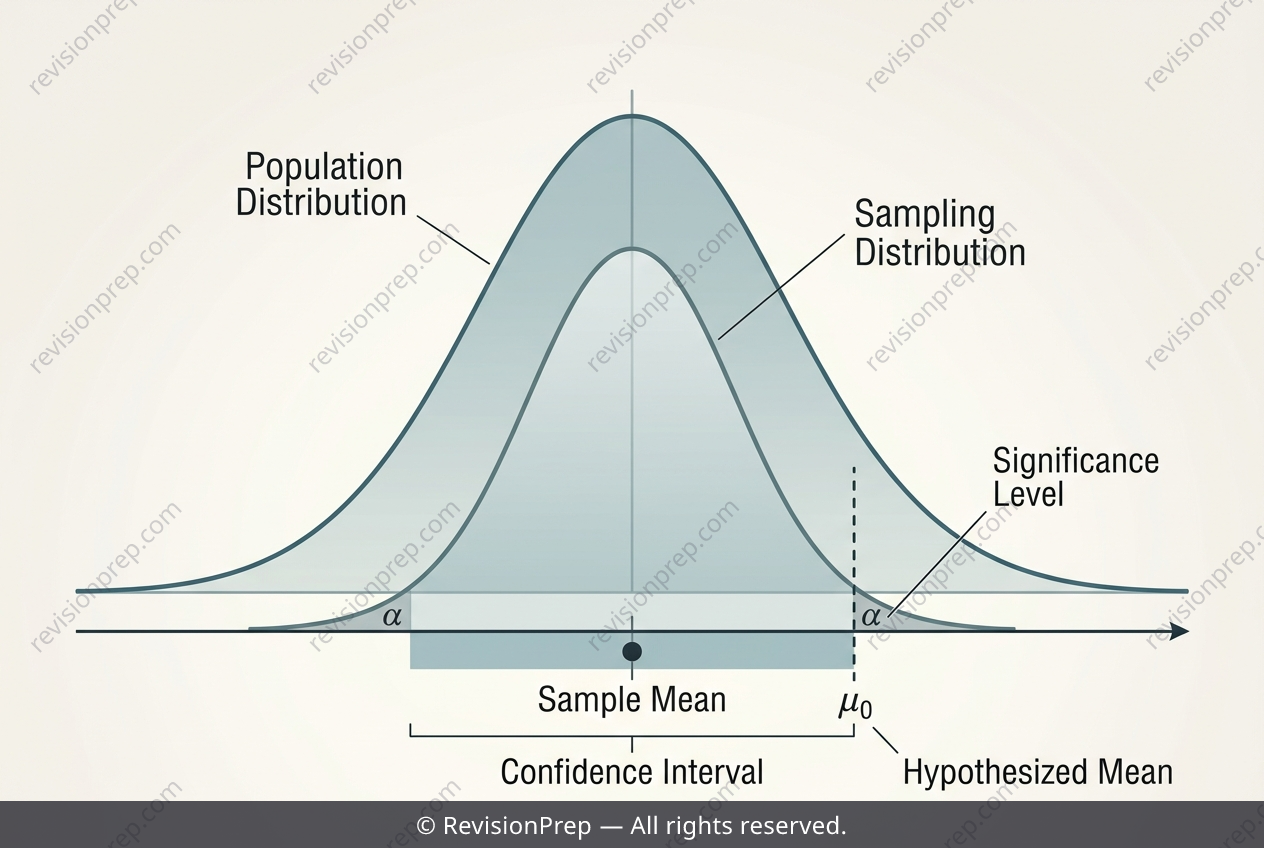
When a production process is working as intended, every rod it makes should have a length clustered around a target mean. But because no factory is perfect, sample means will naturally fluctuate. Inferential statistics gives us a way to decide whether an observed sample mean—like one that seems a bit short—is just random noise or a genuine signal that something has changed. The two tools at the heart of this are confidence intervals and hypothesis testing, which together let us quantify uncertainty and make evidence-based claims about a population parameter we cannot measure directly. The key relationship here is the confidence interval formula: sample mean ± z* × (σ / √n). The critical value z* (1.96 for 95% confidence) sets the width of the interval, while the standard error σ / √n shrinks as the sample size grows—larger samples give tighter, more precise estimates. In this context, the interval is built around the observed sample mean, and the question becomes: does the original target mean (μ₀) fall inside that range? If it does not, as in this case, we have evidence at the 5% significance level that the true mean has shifted. That 5% also represents the probability of a Type I error—concluding a change exists when, in fact, the process is still fine. Thus, the interval and the hypothesis test are two sides of the same coin: one shows the plausible range for the true mean, the other uses that range to make a decision.
Start practising IB questions today
150,000+ IB-styled questions, criteria-mapped and instantly accessible.