
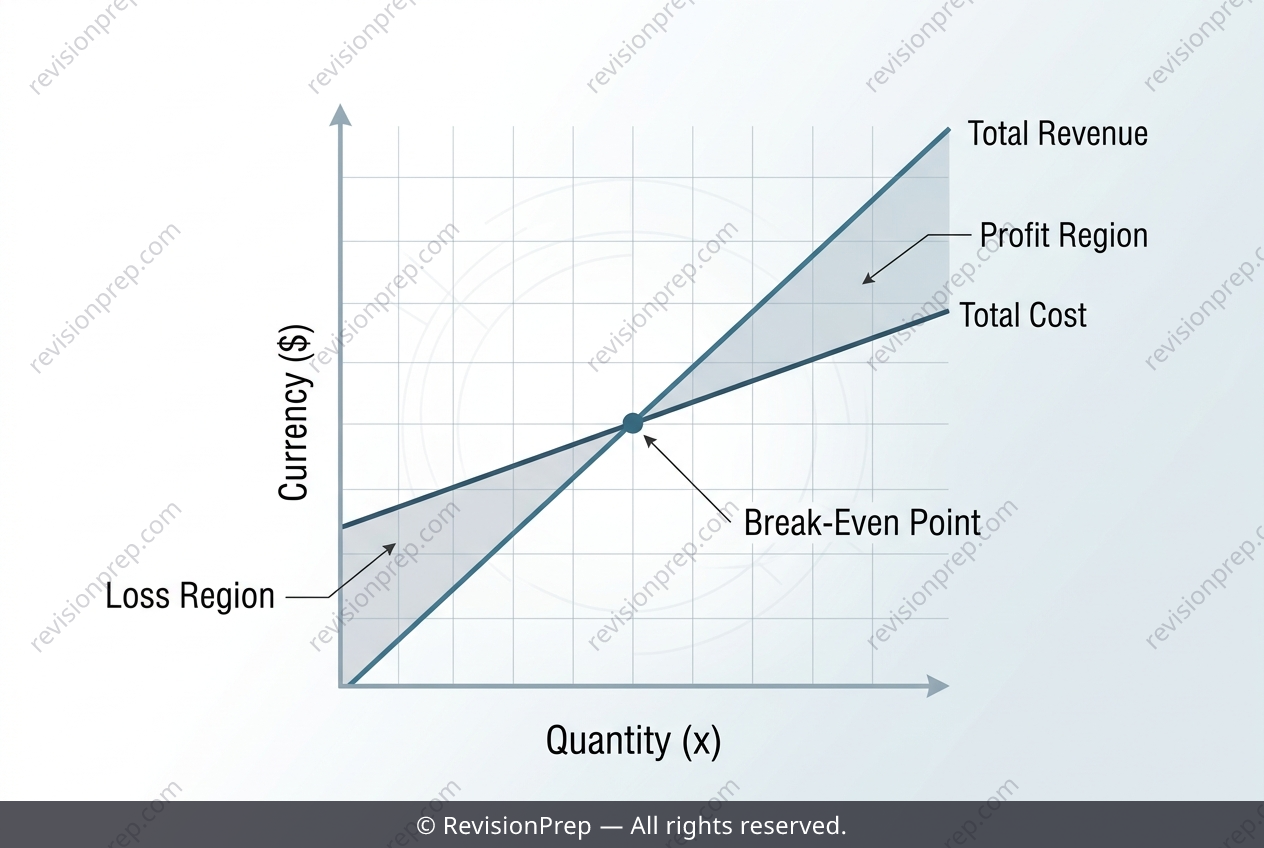
Maths: Break-Even Analysis with Linear Profit Functions
Break-even analysis sits at the heart of linear functions, translating abstract algebra into a concrete business decision. At its core, this topic asks a simple question: at what point does revenue exactly cover total cost? For any linear model, revenue is a straight line through the origin, while total cost combines a fixed component with a variable per-unit rate. The profit function, P(x) = R(x) − C(x), is therefore also linear, and its x-intercept—where profit equals zero—marks the break-even point. What makes this concept powerful is how the parts connect: the slope of the profit function represents the contribution margin per unit (selling price minus variable cost), while the y-intercept reflects the initial loss from fixed costs. In the given candle business, constructing P(x) involves subtracting the cost expression from the revenue expression, yielding a linear form whose zero reveals the required sales volume. The marking scheme stresses that interpreting the x-intercept is not enough—you must compare it against a stated claim. This comparison turns a purely computational exercise into a judgment call, showing how linear functions serve as tools for verifying real-world assertions. Understanding this relationship helps you see why break-even analysis is foundational for budgeting, pricing, and forecasting in any enterprise.
Start practising IB questions today
150,000+ IB-styled questions, criteria-mapped and instantly accessible.