
Maths: Finding the Mode Through Frequency Tables
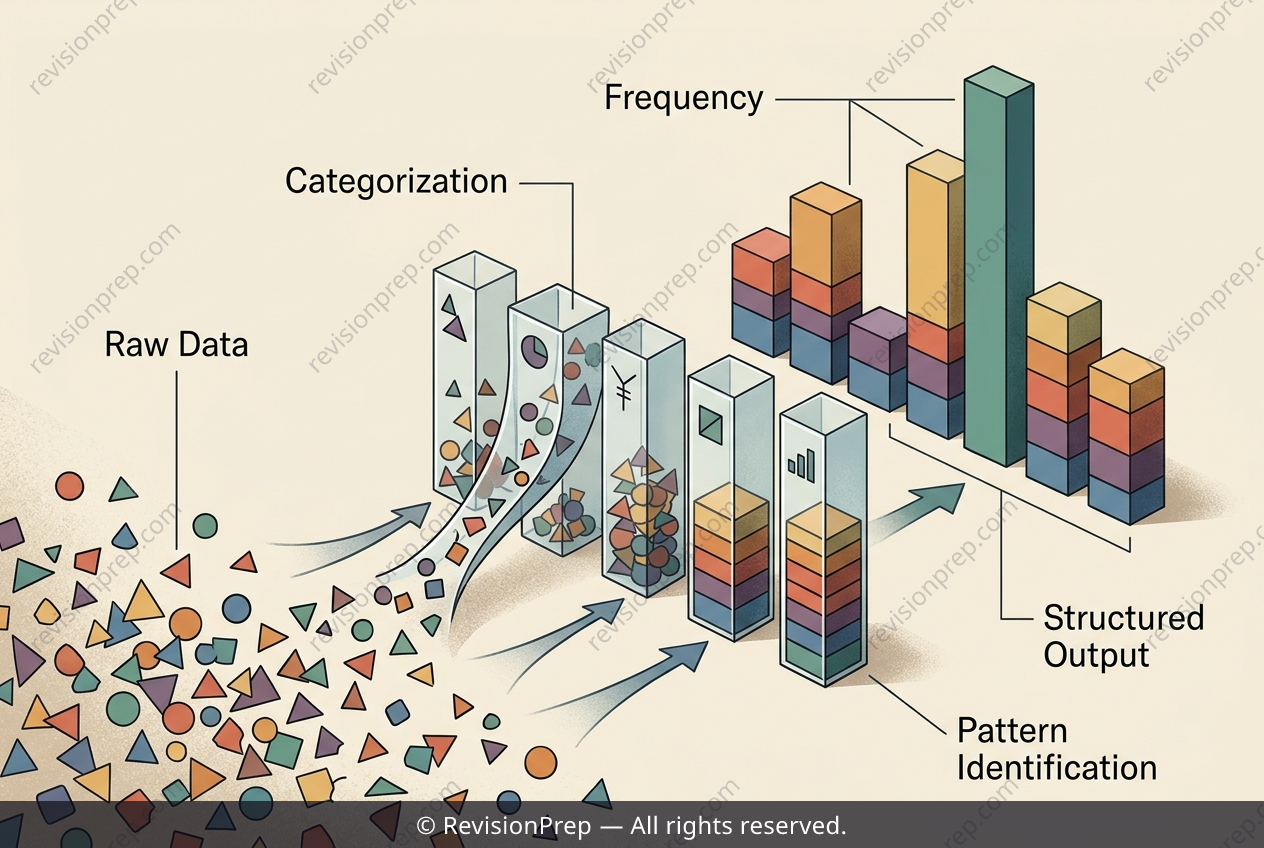
When you collect raw data, it often arrives as a jumbled list of words or numbers—like the favourite fruits of twenty students. The first step toward making sense of that chaos is data classification, which means sorting responses into distinct categories. A frequency table is the tool that does this, pairing each category (the fruit) with a tally (a running count using groups of five) and a final frequency (the total number of times that category appears). The tally is not just a counting aid; it visually groups counts into bundles of five, making it easy to verify that the frequency matches the raw data at a glance. This process matters because it transforms unstructured responses into a clear summary, revealing patterns that are otherwise invisible. The core relationship is simple: frequency = the number of tallies in each row, and the sum of all frequencies must equal the total number of observations (here, twenty). By comparing frequencies, you can identify the modal category—the fruit with the highest count—which is often the key insight from the data. The marking scheme emphasises that each fruit must have its own row, and that the tally and frequency must agree, with the mode being the fruit whose frequency is greatest. This foundational skill underpins everything from bar charts to probability calculations.
Start practising IB questions today
150,000+ IB-styled questions, criteria-mapped and instantly accessible.